
When using Microsoft Project to track their projects, Project Managers want to have the ability to identify any issues that may harm their schedules. One of the best ways to achieve this goal is through the utilization of graphical indicators.
By default Microsoft Project offers an out-of-the-box graphical indicator called ‘Status Indicator’, which presents the current status of a task (to know more about this field, follow this link). In addition, you can create your own custom indicator, based on a formula of your choice.
This article will illustrate how to create a new graphical indicator for the tasks, based on their finish variance and critical path.
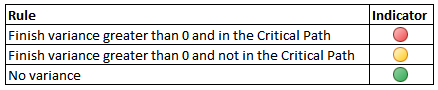
The challenge when creating a new schedule indicator begins in choosing the criteria; if your company is going to use the traditional stoplights, what should be the rules applied to the indicator in order to show the red, yellow and green colors?
The most common answer for this question is to use the percent of variance. In this case, if a barrier is broken, then the indicator changes its color automatically. One common example is:
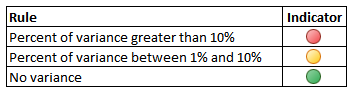
The utilization of rules based on the percent of variance is a good way to see how much the task is slipping compared with what was planned. To create a custom field that calculates the percent of variance in your schedule, follow these steps:
IIf([Baseline Finish]=ProjDateValue(“NA”) Or [Milestone],0,[Finish Variance]/[Baseline Duration]*100)
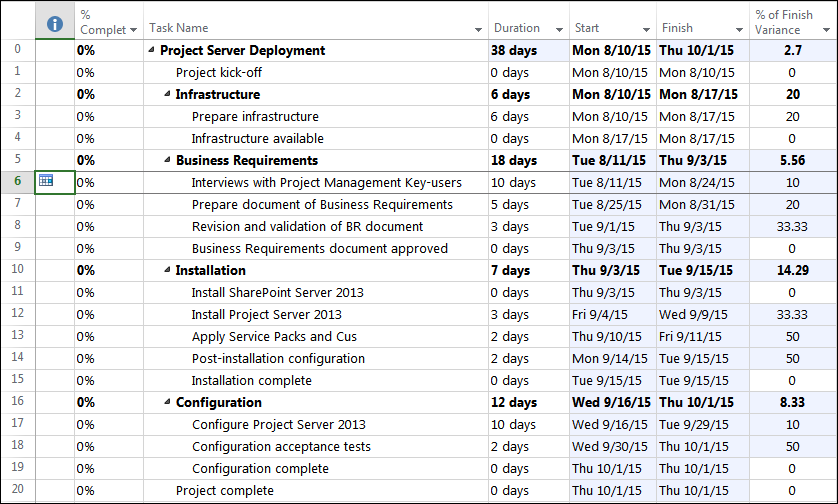
Now, let’s have a look at the picture below. It shows a project plan to implement Project Server 2013:
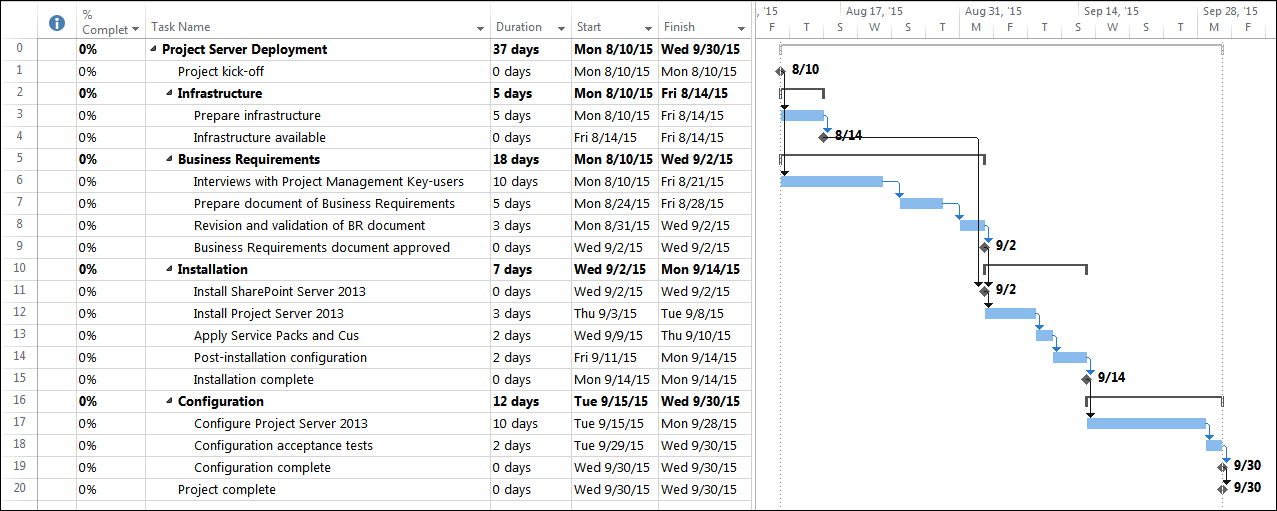
Once your schedule is revised and ready, you can save its Baseline. After that, you will have to insert in the Entry Table the custom field that has been created:
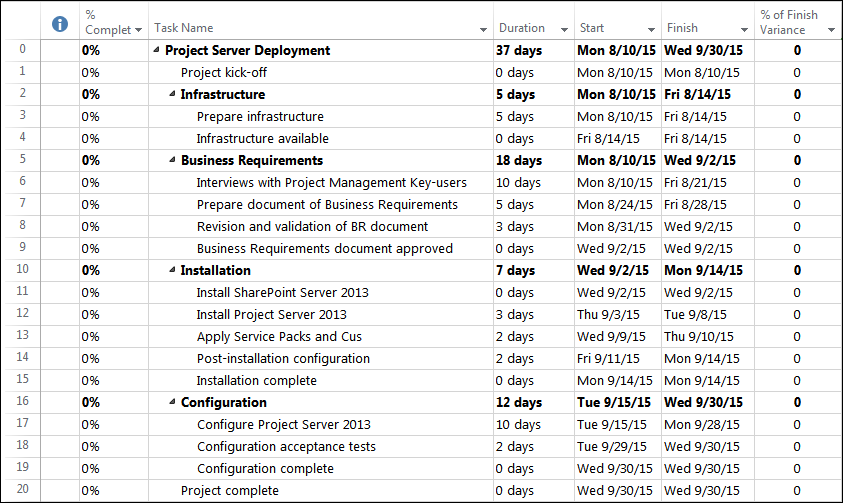
Now let’s say that a resource calls you to say that task number 3 – Prepare infrastructure – needs one more day to be completed. So, instead of 5 days, you will log 6 days as the duration for this task. The result will be:
After changing the duration of the task from 5 to 6 days, it is possible to see that now the field ‘% of Finish Variance’ is showing the number 20, which represents the percent of variance for this task based on what was planned (1 day of variance over 5 planned days of duration). If we were following the criteria proposed for the graphical indicators, it would show the red icon (percent of variance greater than 10%). However, even though the task has a high percent of variance, this variance is not yet causing impact on the overall project. The reason for this is that this task is not in the Critical Path (in other words, this task still has space to be delayed without delaying the project’s finish date).
Let’s look at another simulation. You received a call from your customer, saying that the task number 6 – Interviews with Project Management Key-users – will not start on August 10th as planned, because they will have a critical meeting and not all of the PMs are going to be available. So you change the start of the task to the new proposed date – Tuesday, August 11th. The result will be:
Now we can see that the change we made in this task represents 10% of variance over the planned finish date – and, considering the proposed criteria for the indicator, it should show the yellow icon (percent of variance between 1% e 10%). However, the change on this task has an impact in a considerable number of tasks in the schedule, including the project finish date – as we can see, now the project has a finish variance of 2.7%. And that is because this task is part of the critical path.
So, the point is: even if the task has a minimum percent of finish variance, we should take a closer look to see if it is part of the critical path – because this variance will affect the entire project. At this point, we could consider creating a graphical indicator based on the following criteria:
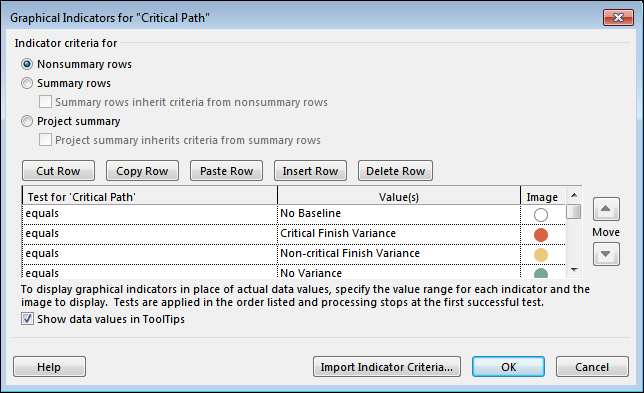
To create the custom graphical indicator, follow these steps:
IIf([Baseline Finish]=ProjDateValue(“NA”),”No Baseline”,IIf([Finish Variance]>0 And [Critical],”Critical Finish Variance”,IIf([Finish Variance]>0 And Not [Critical],”Non-critical Finish Variance”,”No Variance”)))
After creating the graphical indicator, you will have to add it to the Entry Table:
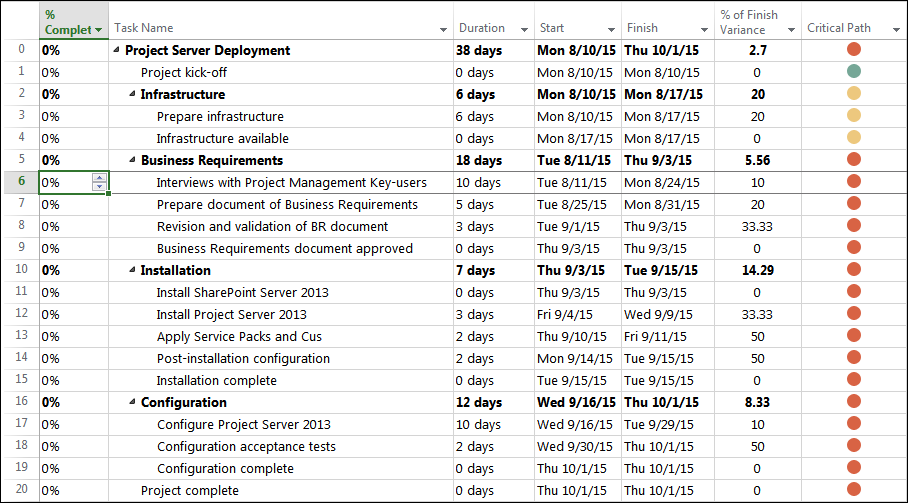
Now you can have a better understanding of your project, by combining the percent of finish variance for the task (which is an important information) with the real impact this finish variance is causing on your schedule.
")