One of the most common requests we get from our clients is for automated status reporting, ideally integrated with PowerPoint with the ability to export to PDF.
Microsoft recently released a PPM Power BI add-in for PowerPoint that enables you to add live, interactive data from Power BI to your presentations. Microsoft refers to this as “storytelling”.
Microsoft Project for the web: E-Learning
How to use Microsoft Teams for Project Management
First, you’ll need to grab the Power BI add-in from the Office Store, although Microsoft 365 users should see it by default from PowerPoint very soon. From the insert tab, go to ‘My Add-ins’. Then, click on ‘see all’ and go to the ‘Store’. Search for Power BI and add the Microsoft Power BI add-in, as shown in Figure 1.
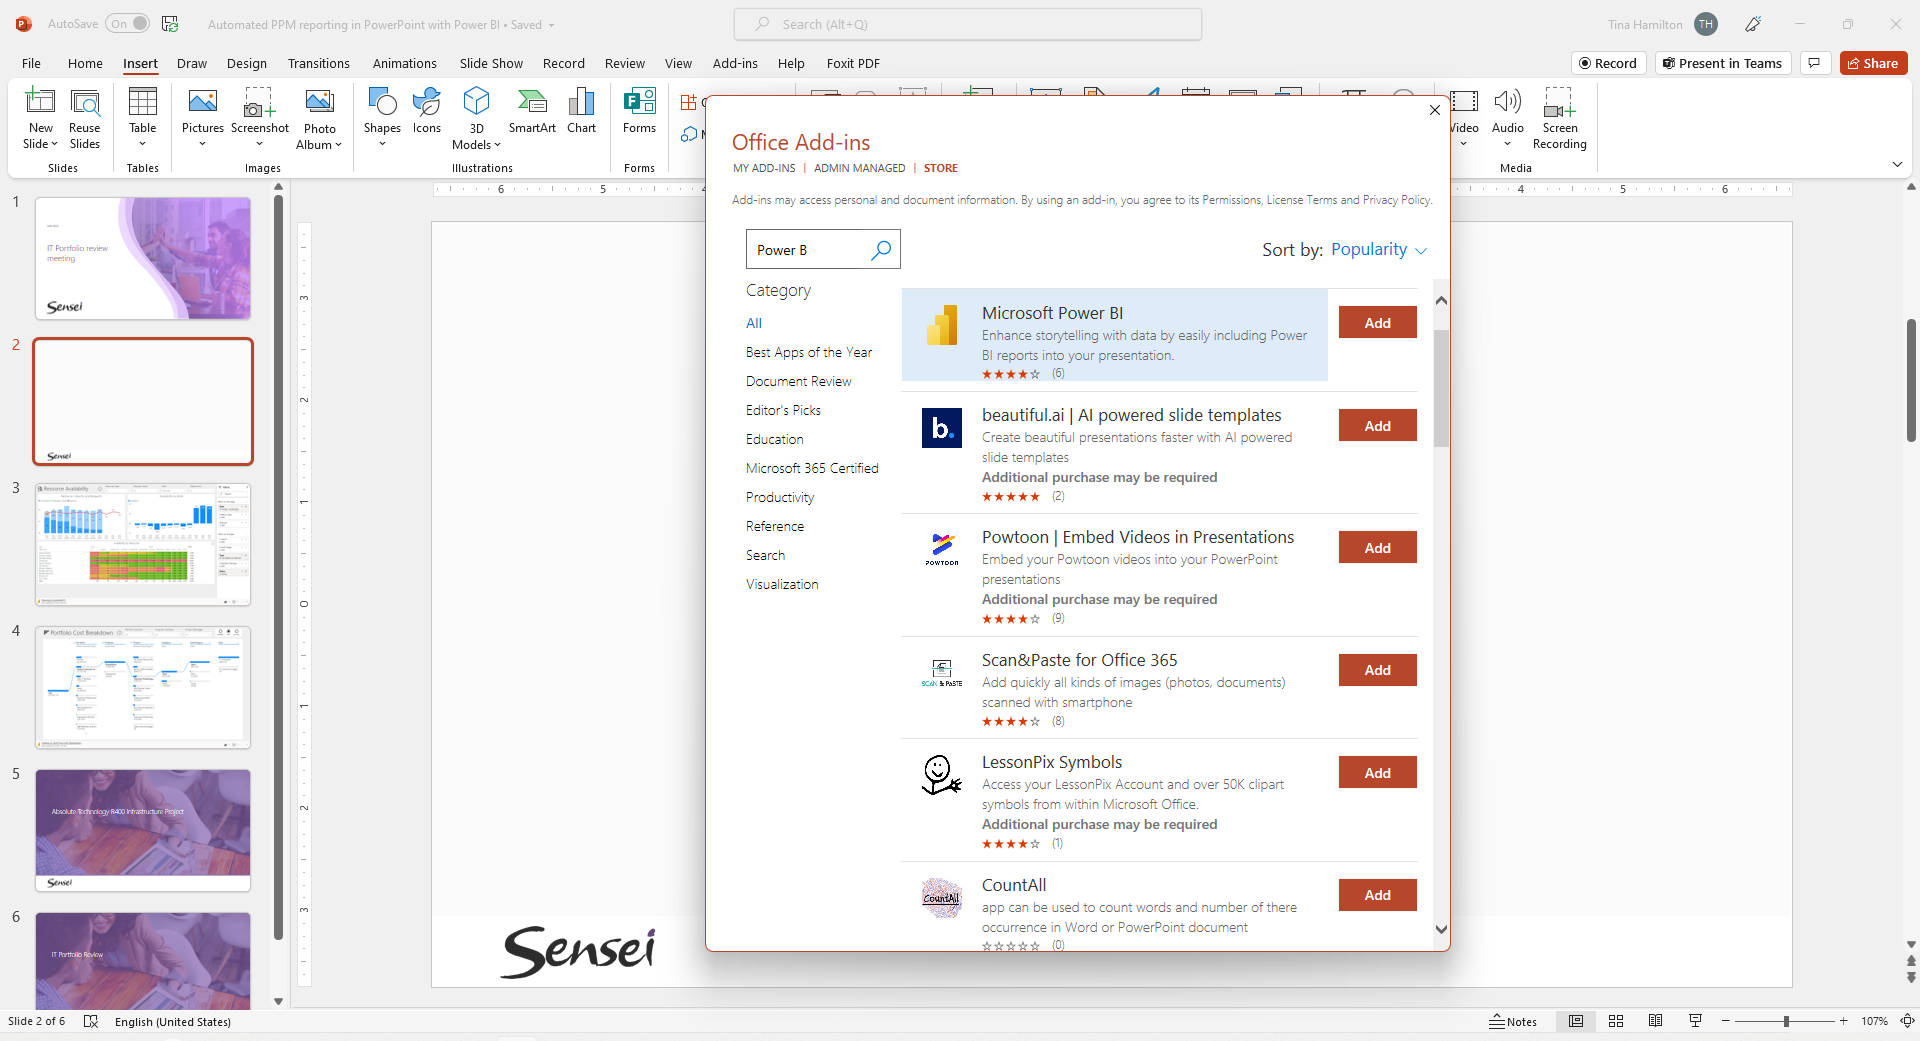 |
| Figure 1 – Adding the Power BI Add-in from the Office Store |
After you do this for the first time, it will show up under ‘My Add-ins’, as shown in Figure 2.
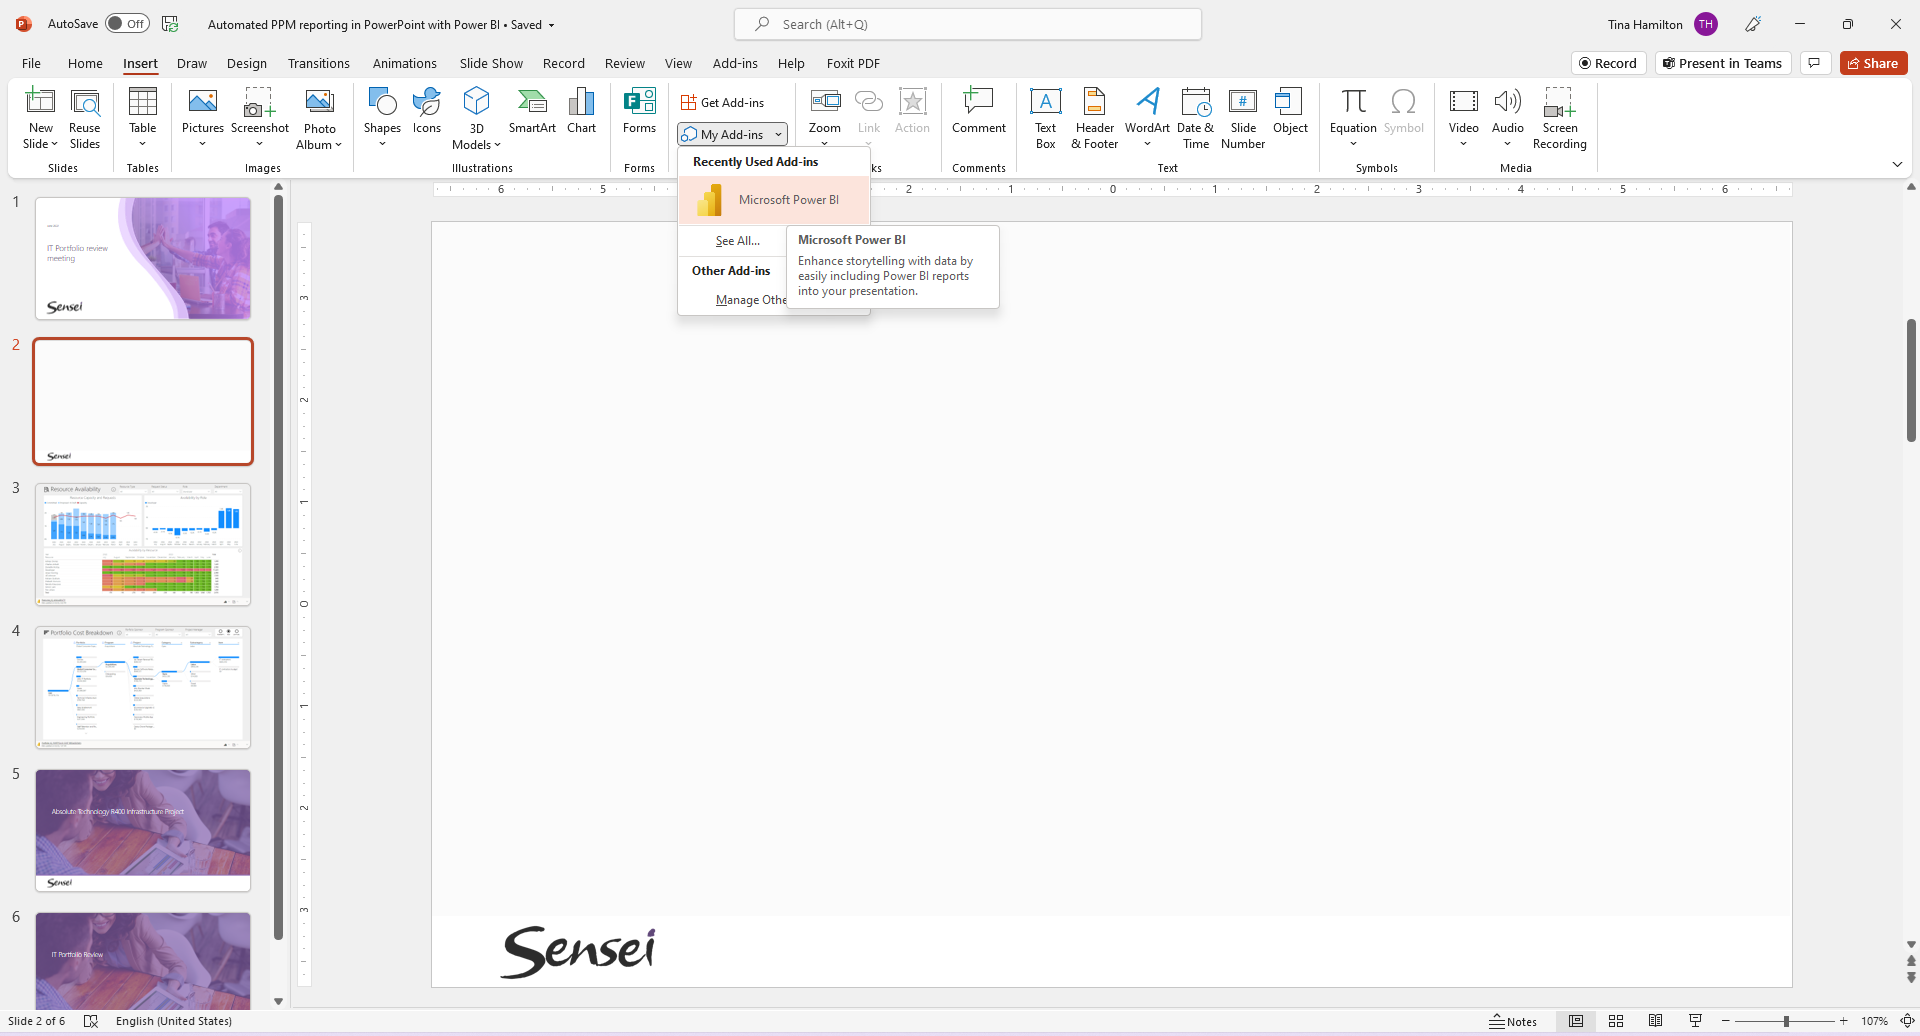 |
| Figure 2 – Accessing the Power BI Add-in for PowerPoint |
Next, go to the Power BI report you want to use in the presentation. Be sure to filter for the data you want to show. As shown in Figure 3, we are filtering for projects in the IT Department.
There are two ways to grab the URL from the Power BI report of your choice. The first way is by navigating to ‘Export’ > ‘PowerPoint’ > ‘Embed Live Data’.
 |
| Figure 3 – Adding the Power BI Report to PowerPoint (Option 1) |
I prefer the second option, which is: ‘Share’ and then ‘PowerPoint’. Both get us to the same dialog, but the second also gives report access to your audience in case they don’t already have viewing access.
 |
| Figure 4 – Adding the Power BI Report to PowerPoint (Option 2) |
As shown in Figure 5, click ‘Copy’ to send the URL to your clipboard.
 |
| Figure 5 – Copy Power BI Link to PowerPoint |
Back in PowerPoint, you simply paste the URL in the dialog box and press insert.
 |
| Figure 6 – Paste Power BI Link to PowerPoint |
You will know the report is live because you can interact with the data. If you mouse over a project, it will show the most recent status update. You can drill through to the detailed status report for that individual project and navigate to the various levels of detail, as shown in Figures 7, 8, and 9.
 |
| Figure 7 – Power BI Report in PowerPoint (All Projects) |
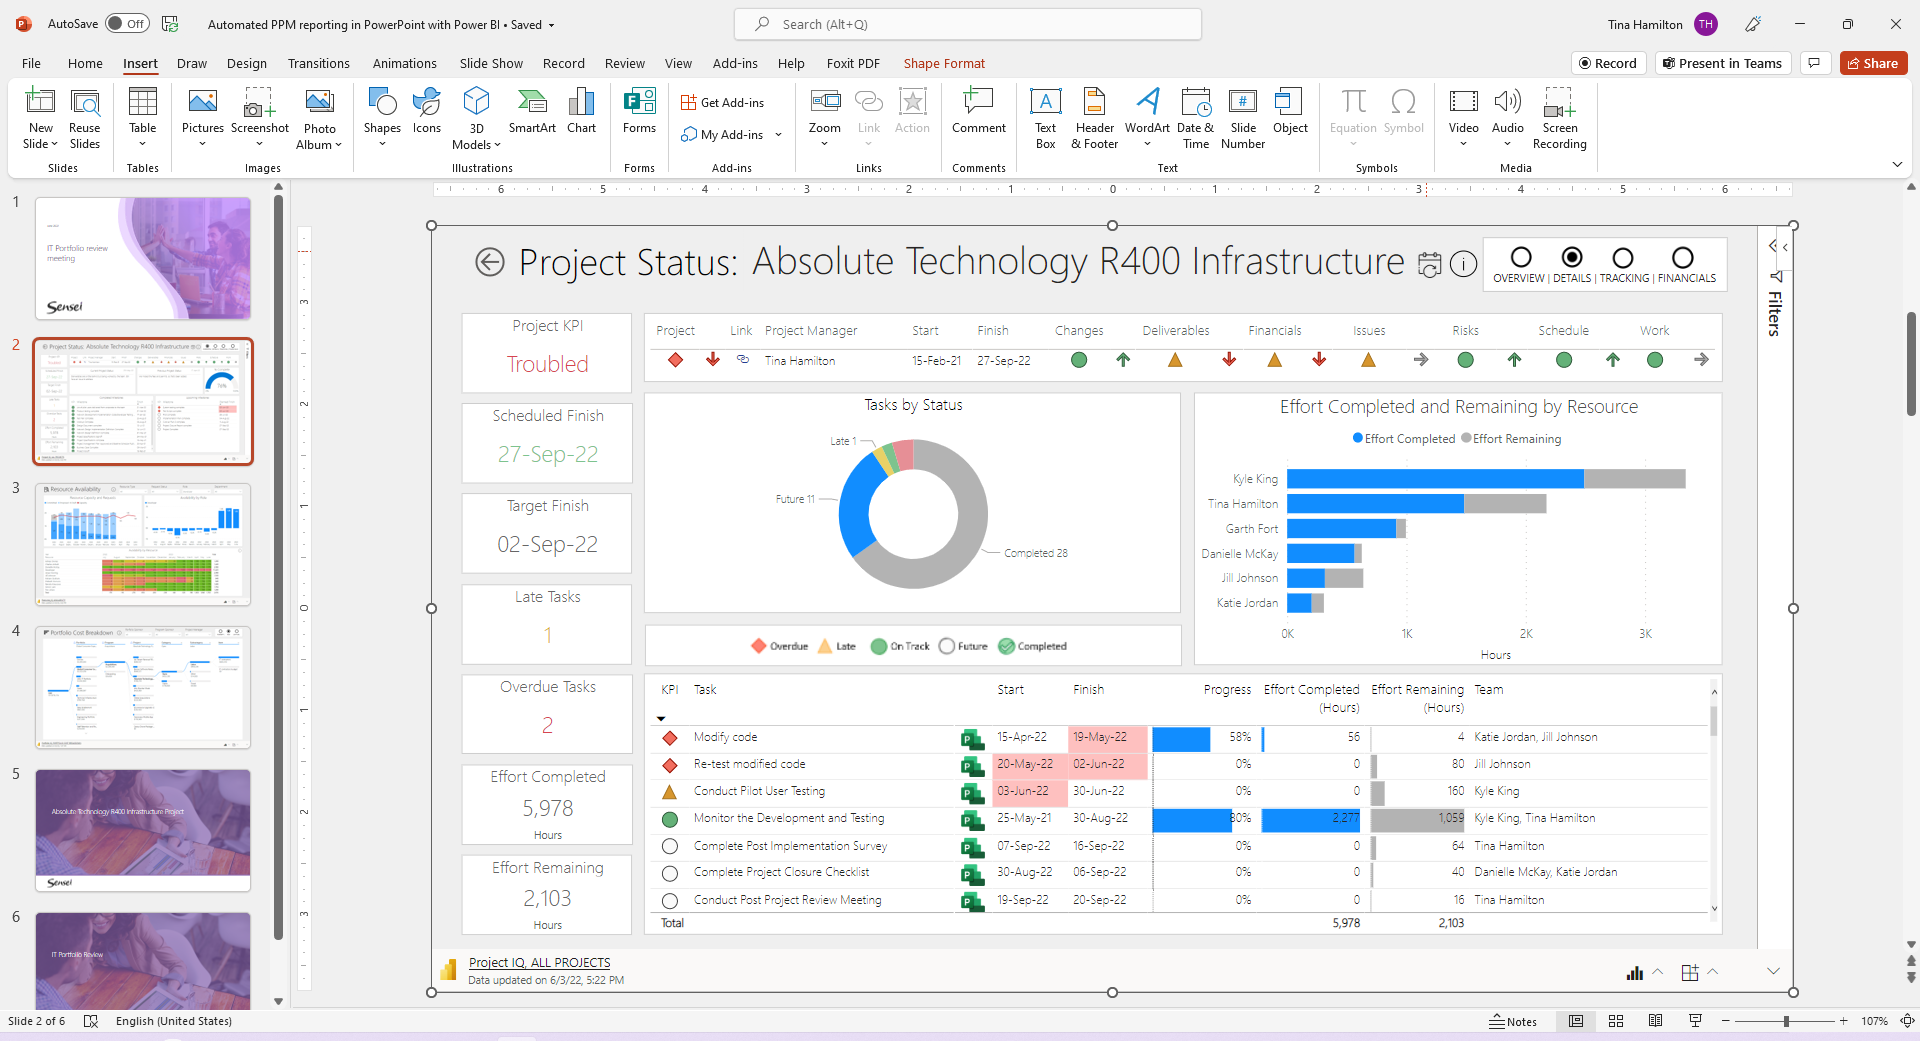 |
| Figure 8 – Power BI Report in PowerPoint (Project Details) |
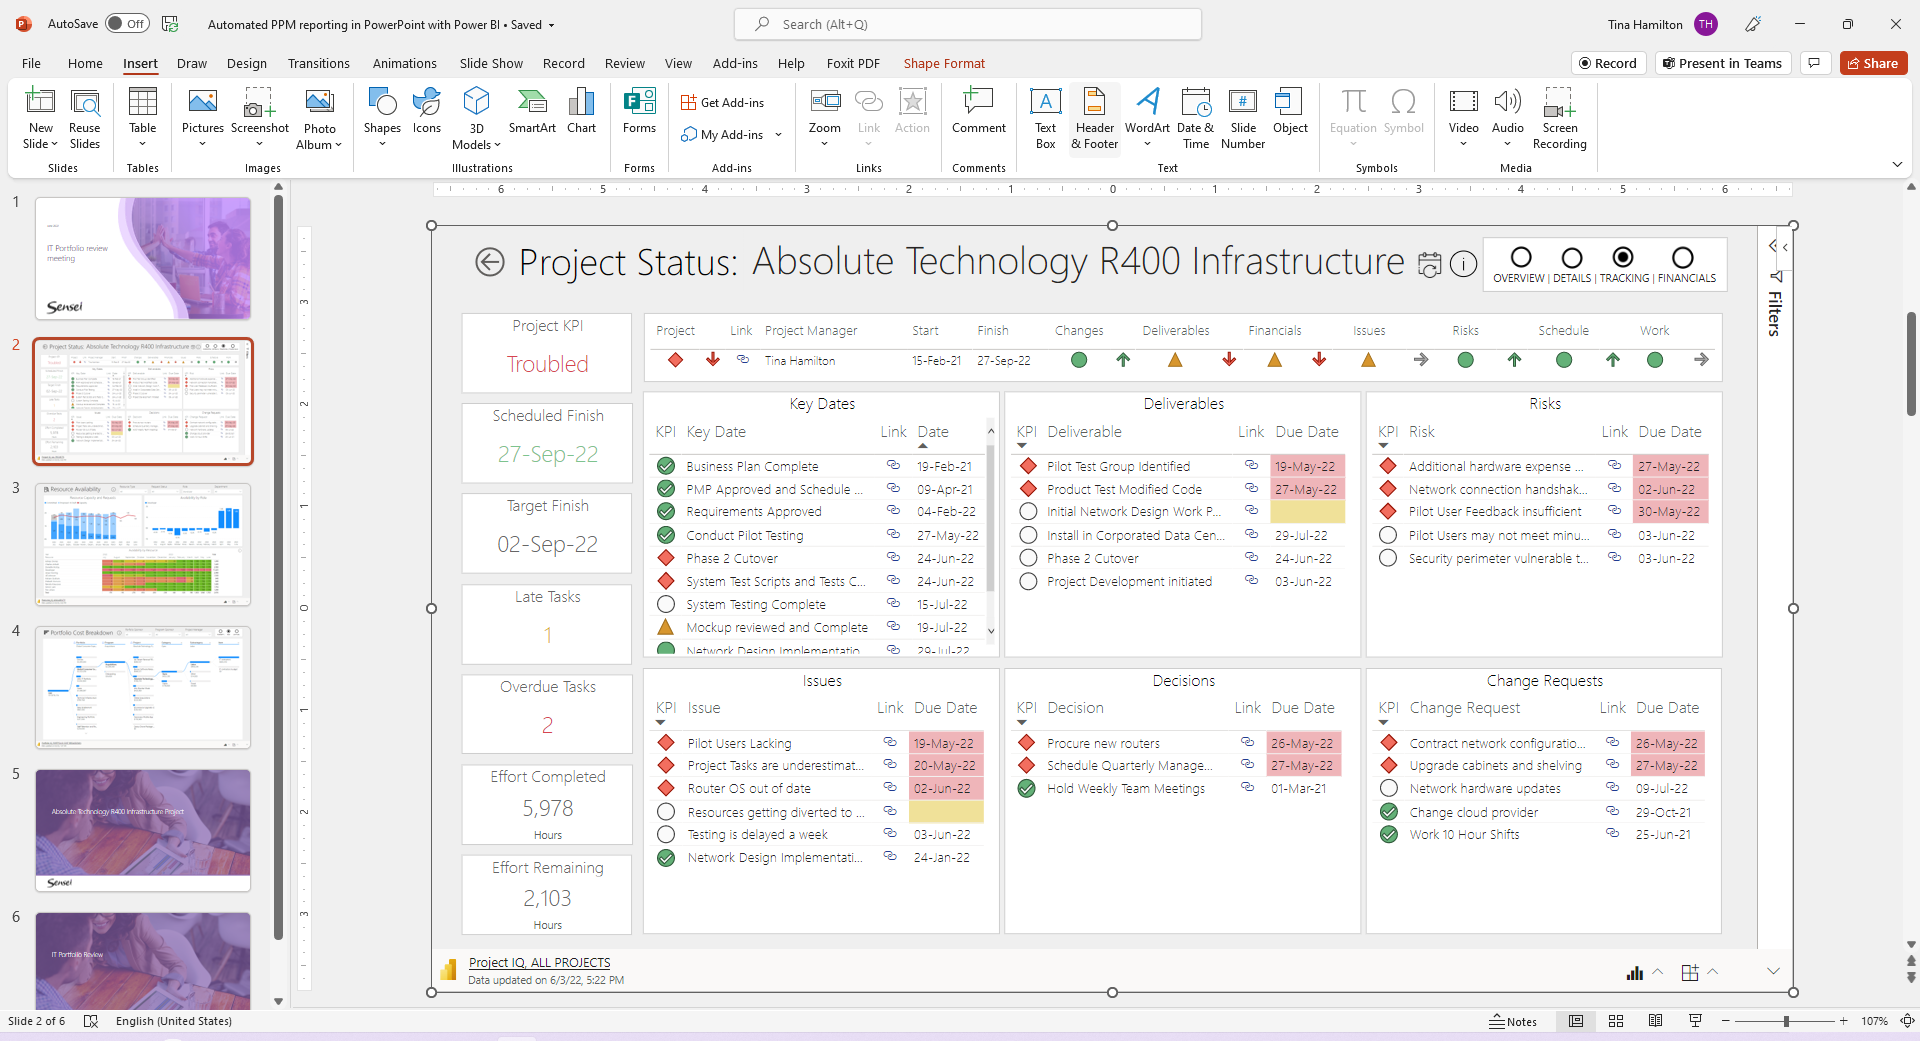 |
| Figure 9 – Power BI Report in PowerPoint (Project Tracking) |
It’s easy to reset or refresh the report data from the ‘Data Options’ menu at the bottom, as shown in Figures 10 and 11.
 |
| Figure 10 – Resetting Power BI data in PowerPoint |
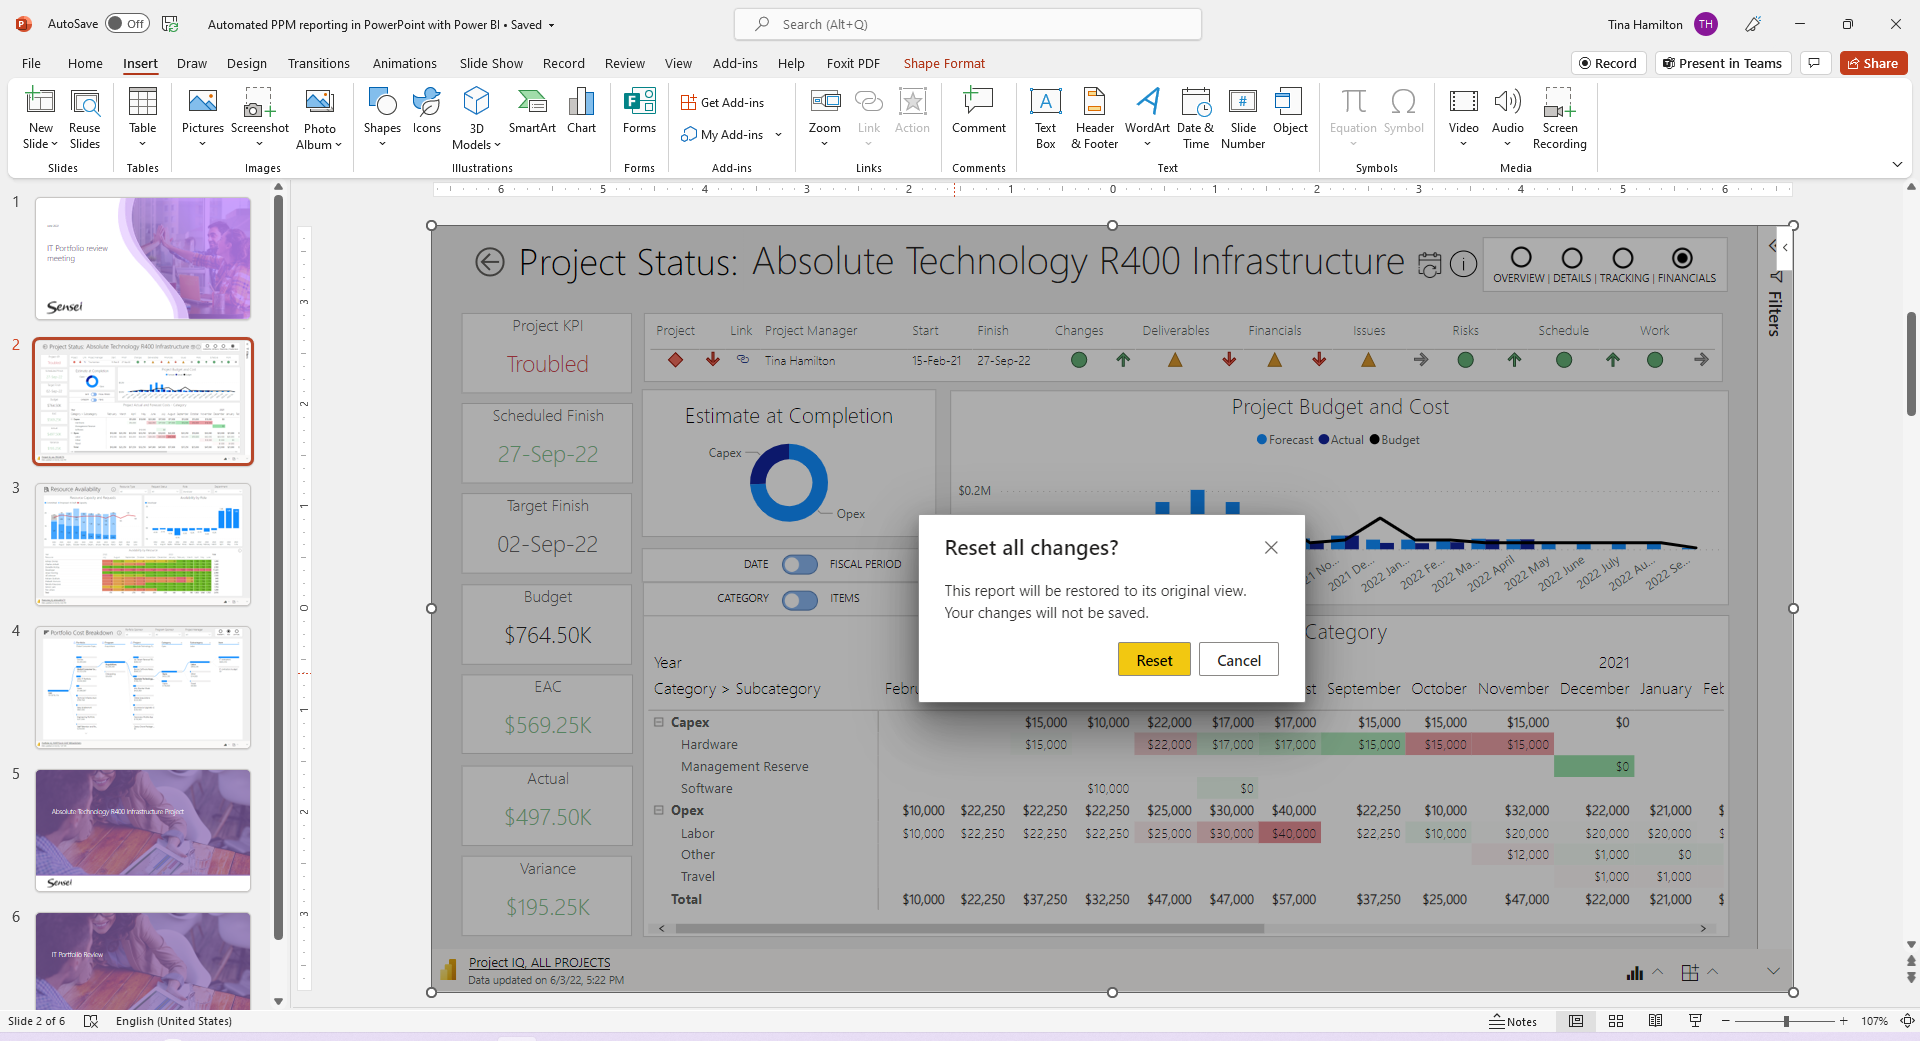 |
| Figure 11 – Resetting Power BI data in PowerPoint |
In some scenarios, you may want to freeze the data in case you’re sharing the presentation with someone who doesn’t have access to the report or if you just want to ensure that the data doesn’t change. As shown in Figure 12, go to the top right corner of the add-in and from the menu, select ‘Show as Saved Image’. This will turn the add-in into an image, allowing you to send this PowerPoint or PDF to your key stakeholders.
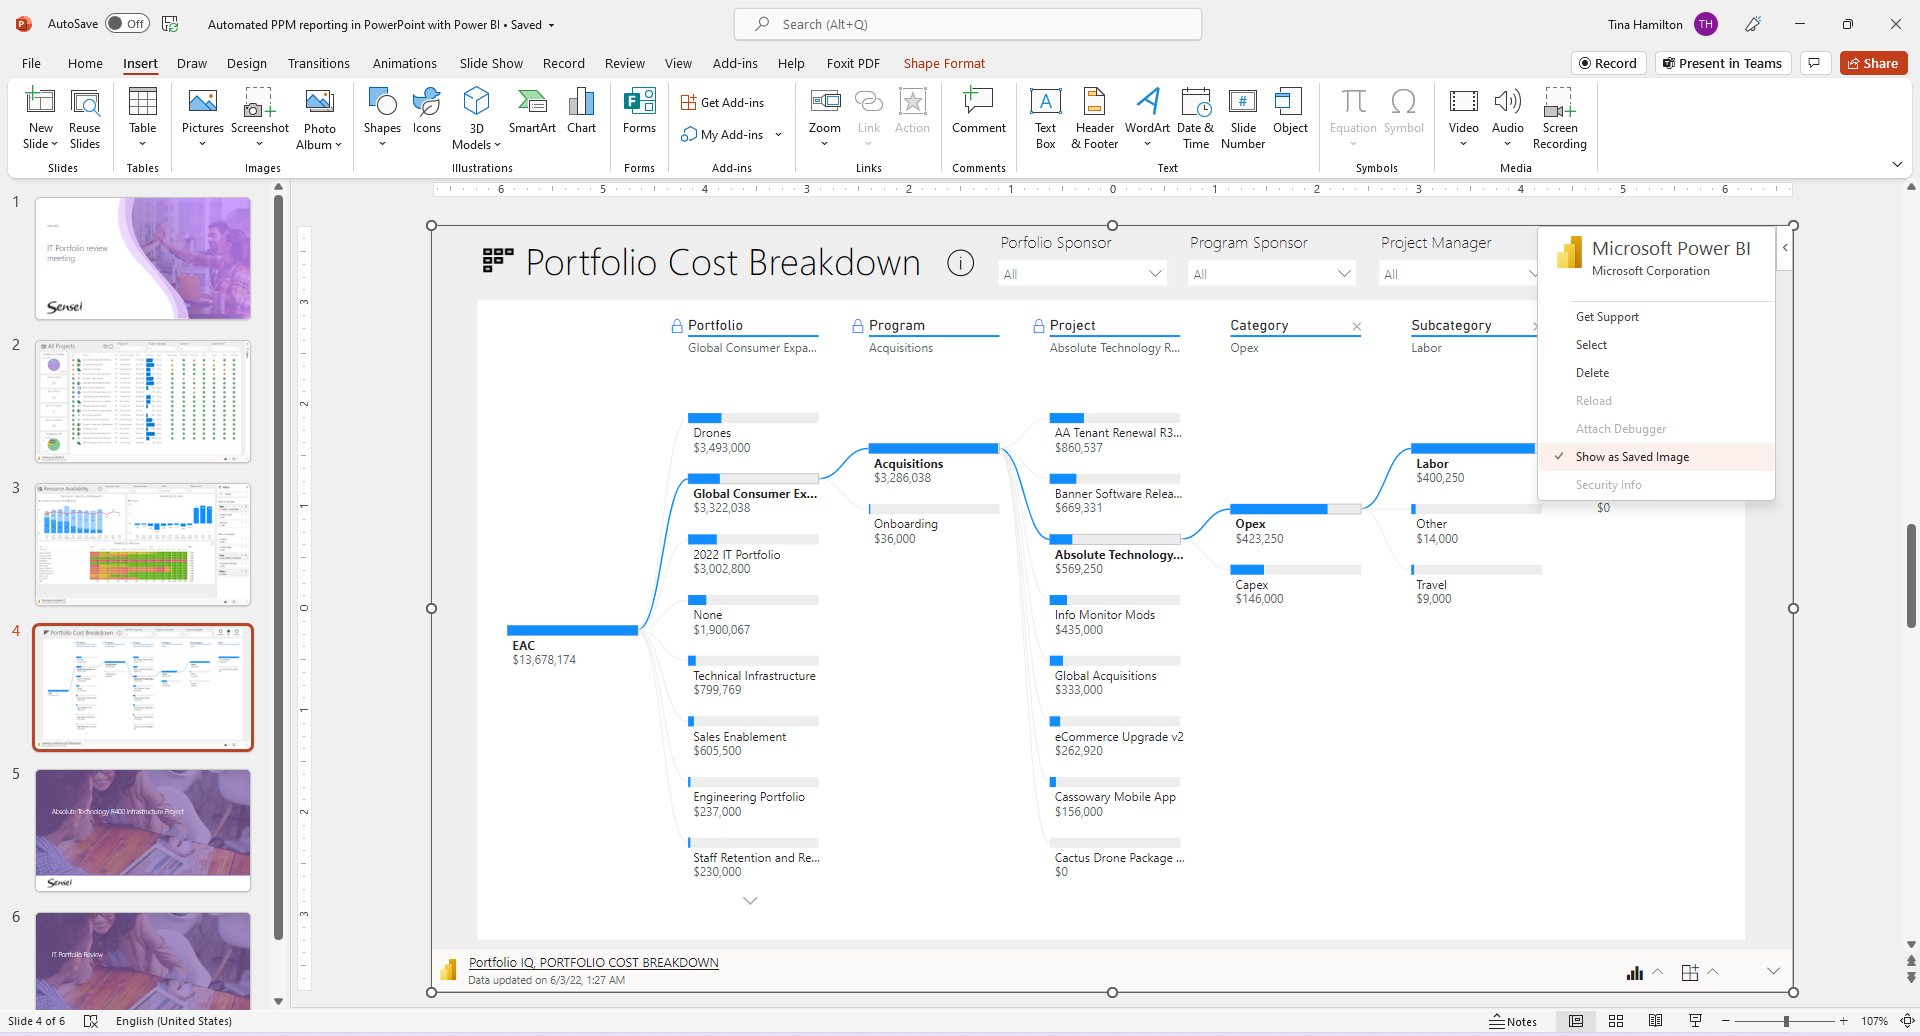 |
| Figure 12 – Saving the Power BI Report as an Image |
The add-in works really well with the Power BI Content Packs for both Project Online and Microsoft Project for the web. You can download those here:
DOWNLOAD:
Project for the web – Power BI Template
Project Online – Power BI Template

CEO, Sensei

Sensei Project solutions is a recognized global leader in Microsoft project and portfolio management (PPM) solutions focused on improving the way your team works. Sensei’s unique turn-key PPM Platform in the Microsoft Cloud, Sensei IQ™, is designed around your needs and a modern way of working. Sensei IQ™ helps you make informed decisions by understanding how all work fits together with meaningful insights into projects, resources and programs across your portfolios.