Most Microsoft Project users do not know that the software contains a default view named Relationship Diagram. This view allows you to see the direct Predecessors and Successors for any selected task. For example, in the Relationship Diagram view shown in Figure 1, notice that the selected task has one direct Predecessor and three direct Successors. Notice also that you can see that the dependency relationship is Finish-to-Start (FS) with each of these tasks.

The Relationship Diagram view is not very useful as a standalone view, but it is extraordinarily useful when applied as the secondary view in a combination (split screen) view. For example, there are at least three common views where you cannot see Predecessor and Successor relationships because the view does not contain a Gantt Chart pane. These views include the Task Sheet, Task Usage, and Resource Usage views. Applying the Relationship Diagram as the secondary view in a combination view with one of these three views will allow you to see the task dependency relationships clearly and easily.
To apply the Relationship Diagram as the secondary view in a combination view, complete the following steps:
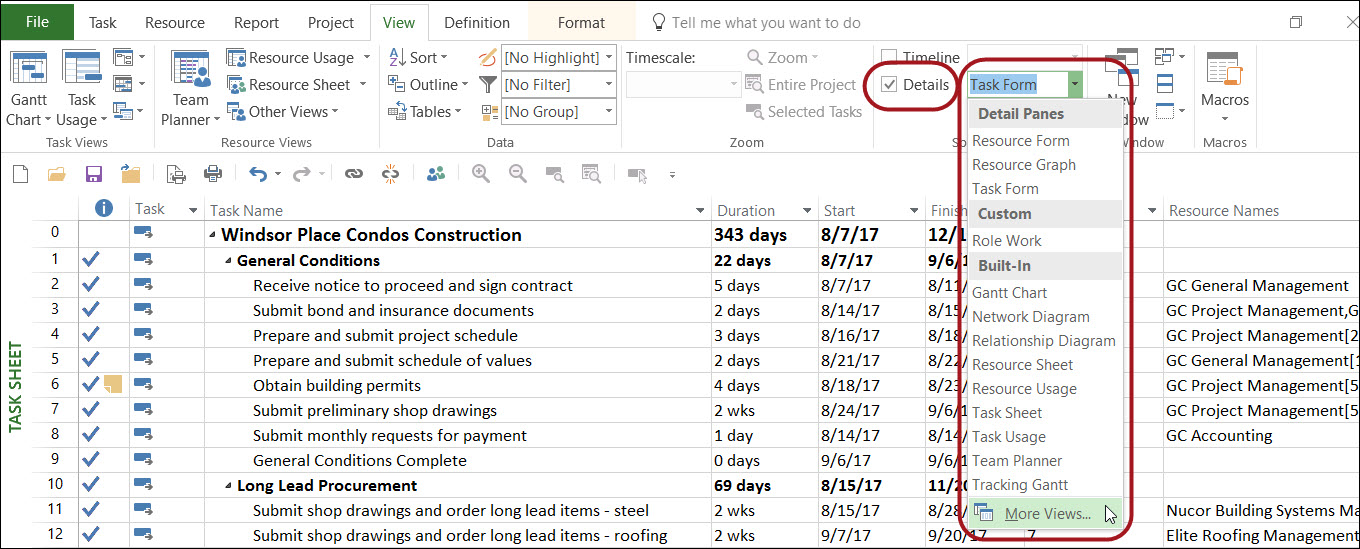
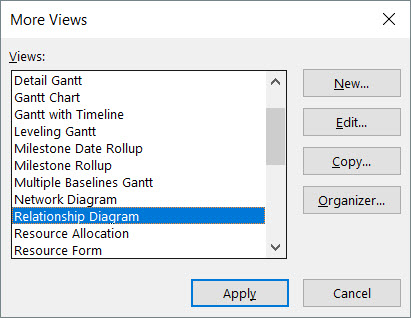
Figure 4 shows a combination view with the Task Sheet view in the top pane and the Relationship Diagram in the bottom pane. Notice in the Task Sheet pane that you can see only the task ID numbers of the Predecessors for the selected task, but you cannot see the names of the Predecessor tasks, nor can you see Successor tasks. Notice that the Relationship Diagram pane shows the names and ID numbers of all of the direct Predecessors and director Successors for the selected task, along with the task dependency types for each task.
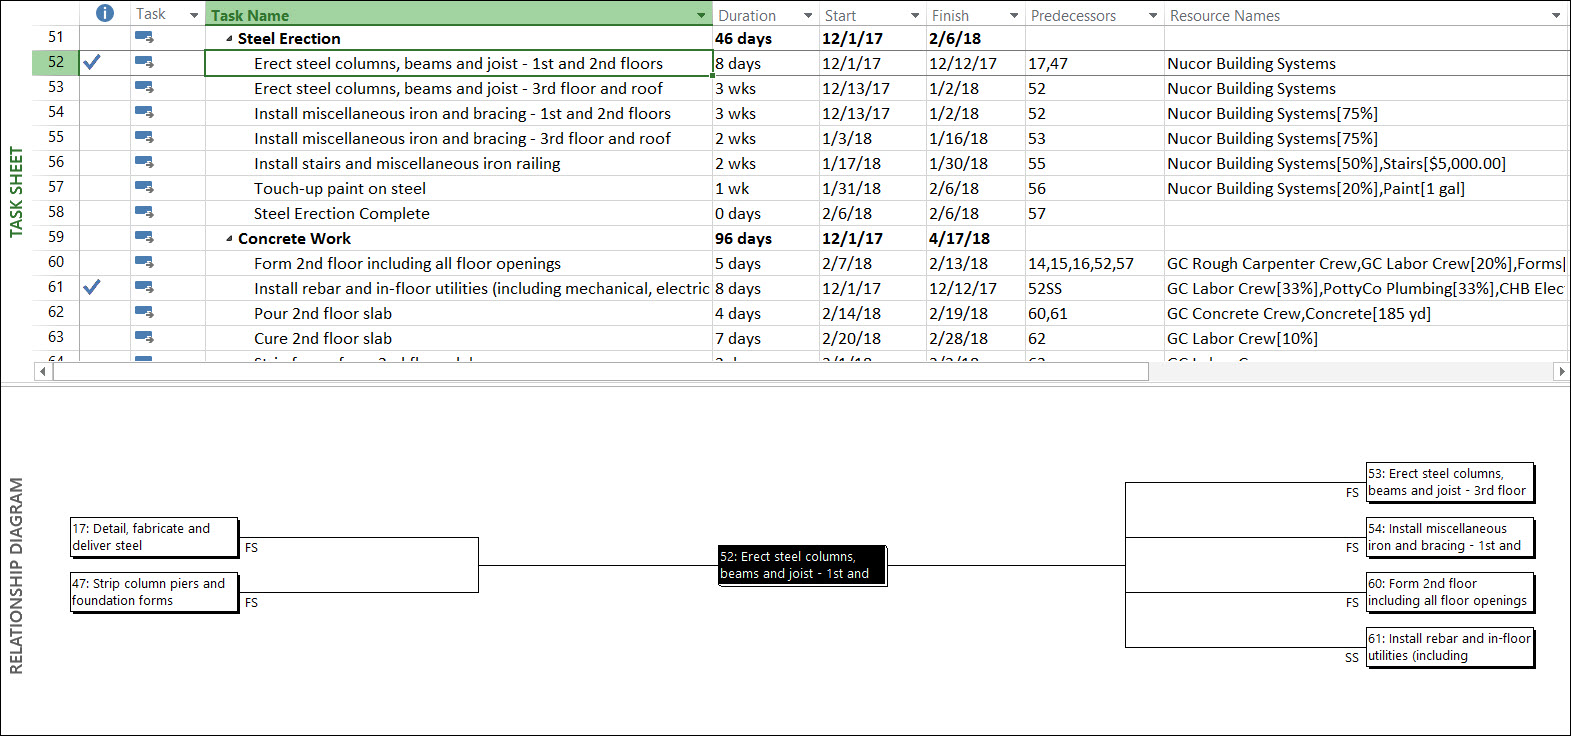
Figure 5 shows a combination view with the Task Usage view in the top pane and the Relationship Diagram view in the bottom pane. Because the Task Usage view contains a timephased grid rather than a Gantt Chart, you cannot see task dependency relationships. However, when you include the Task Usage view in a combination view with the Relationship Diagram view, you can easily determine task dependency relationships. For example, notice in Figure 5 that the selected task in the Task Usage pane has two direct Predecessors and four director Successors, as shown in the Relationship Diagram pane.
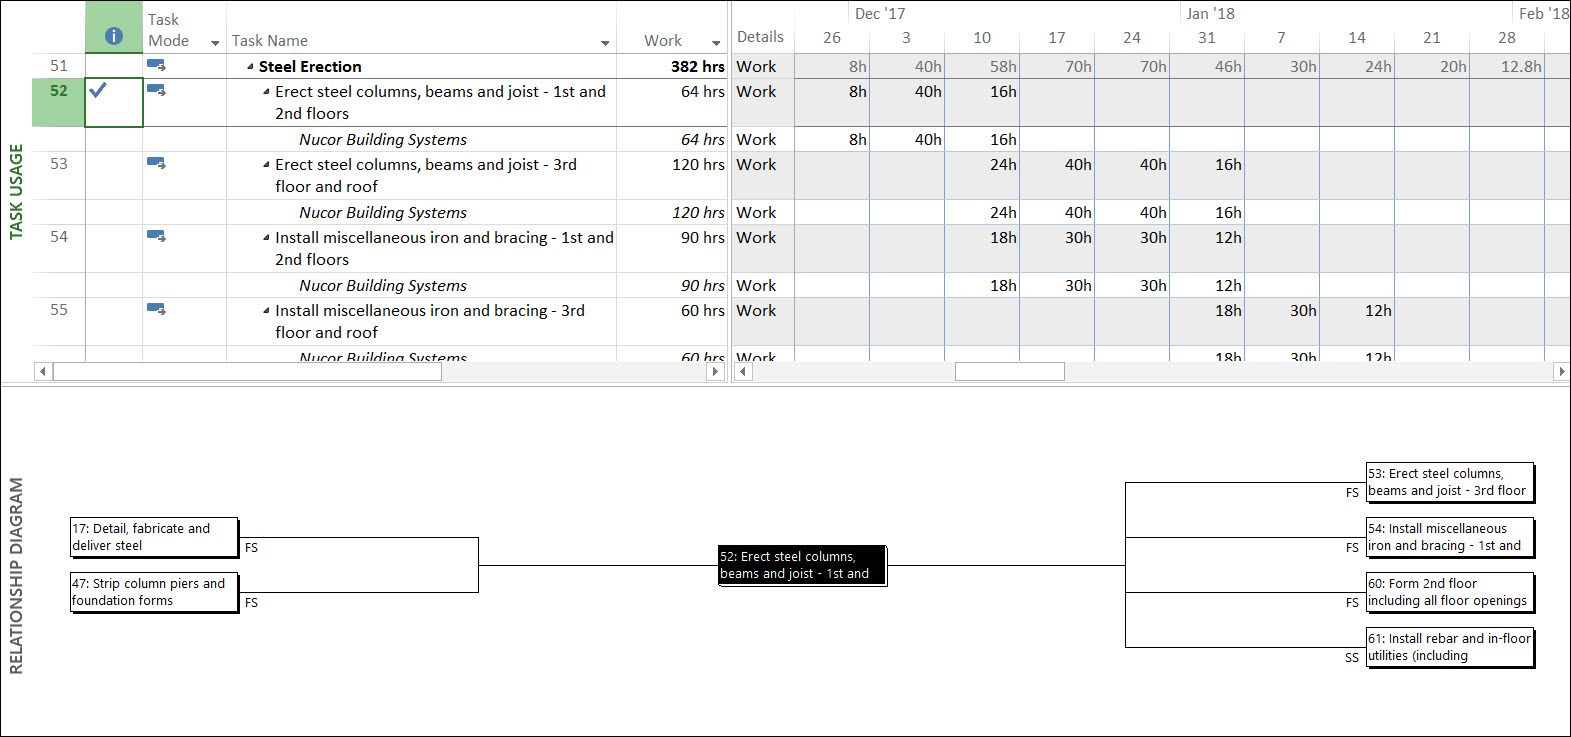
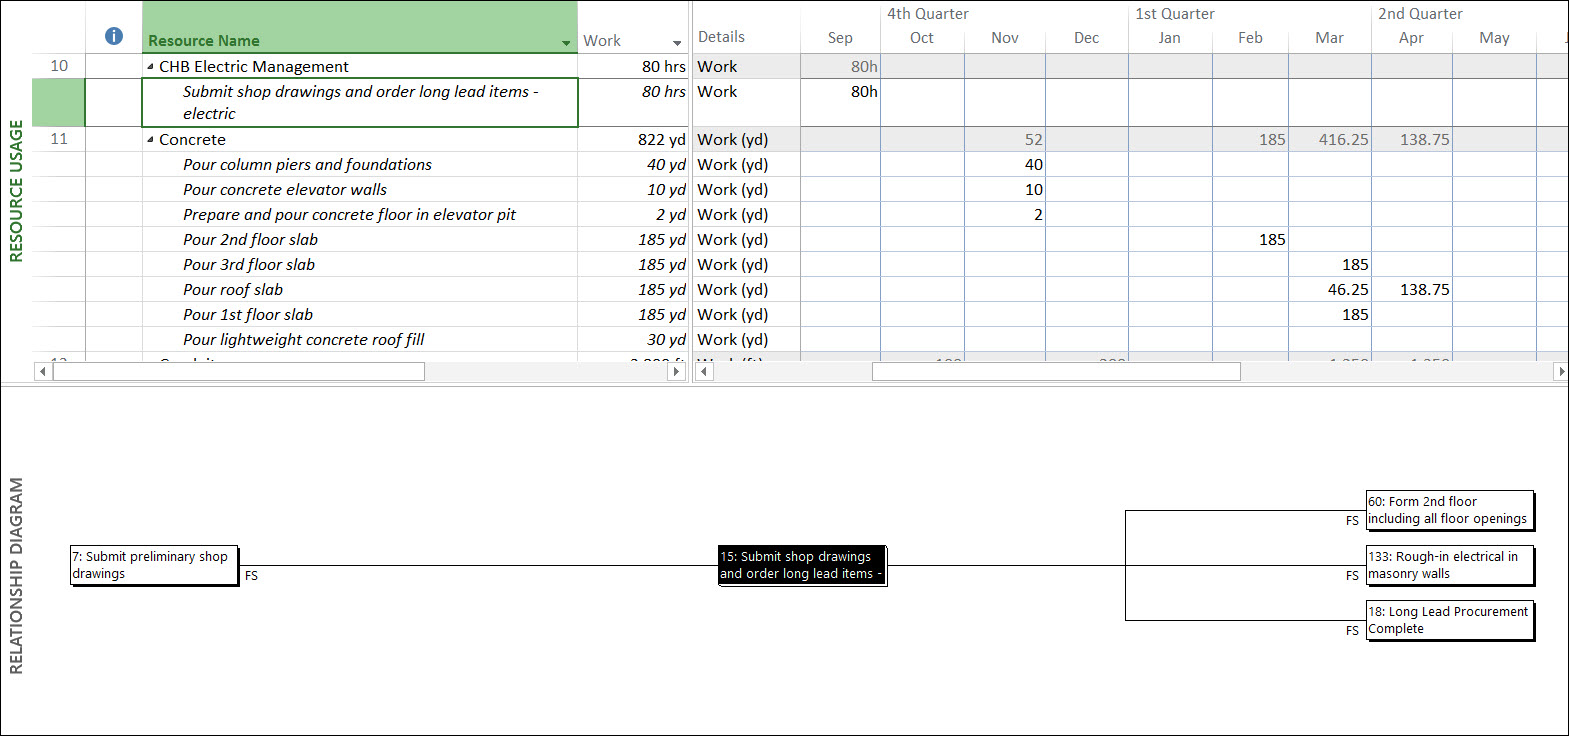
Figure 6 shows a combination view with the Resource Usage view in the top pane and the Relationship Diagram view in the bottom pane. Because the Resource Usage view is a resource view that also shows task assignments, you cannot see task dependency relationships for the task assignments. However, when you include the Resource Usage view in a combination view with the Relationship Diagram view, you can select any task assignment and then easily determine task dependency relationships. For example, notice in Figure 6 that the selected task assignment in the Resource Usage pane has one direct Predecessor and three director Successors, as shown in the Relationship Diagram pane.

Sensei Project solutions is a recognized global leader in Microsoft project and portfolio management (PPM) solutions focused on improving the way your team works. Sensei’s unique turn-key PPM Platform in the Microsoft Cloud, Sensei IQ™, is designed around your needs and a modern way of working. Sensei IQ™ helps you make informed decisions by understanding how all work fits together with meaningful insights into projects, resources and programs across your portfolios.