As you might be aware, Microsoft recently announced an updated Power BI Content Pack for Microsoft PPM, which contains 13 pages that provide key information about Portfolio Reporting, Resource Reporting, and Project Reporting. If you are interested in knowing more about what is included in the new Power BI PPM Content Pack, read the article written by Sensei’s CEO Kenneth Steiness that discusses in detail each aspect of the content pack: https://www.senseiprojectsolutions.com/2017/10/18/new-microsoft-ppm-power-bi-content-pack/
The Power BI PPM Content Pack by default doesn’t specify a language, which means it defaults to English-US. If your Project Online instance uses a different language, you will need to make a few updates to point to the right fields. If you install the Power BI Content Pack from the Microsoft AppSource, although the data connection explicitly states that all the fields should be retrieved in English, the built-in custom fields that are included in Project Online are not translated. This means that their names will still be represented in their non-English language – in my case, the Brazilian Portuguese. However, as the content pack uses the English field names, we need to take some corrective actions.
I will use myself as an example: I have an instance of Project Online that has been configured in my mother language, which is the Brazilian Portuguese. So, I’ll walk you through the process that I followed to deploy it into my instance.
You will need to download the content pack from GitHub, as opposed to from the App Source, to make the changes I will describe in this post, as this makes the reports available through a Power BI Template file:
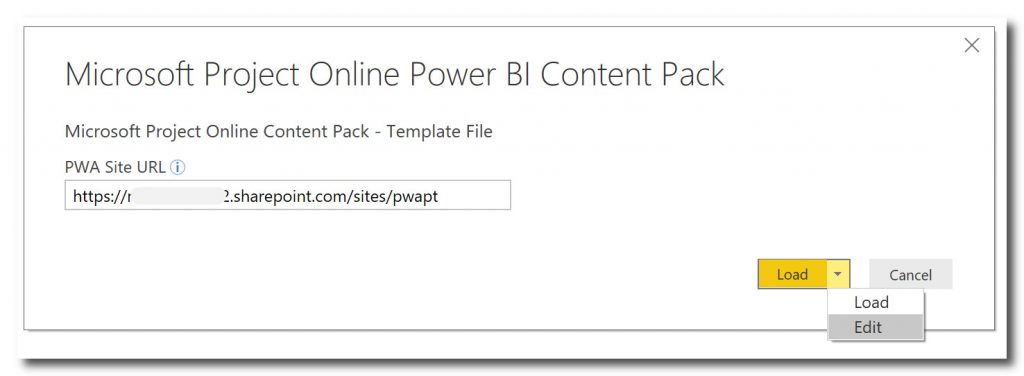

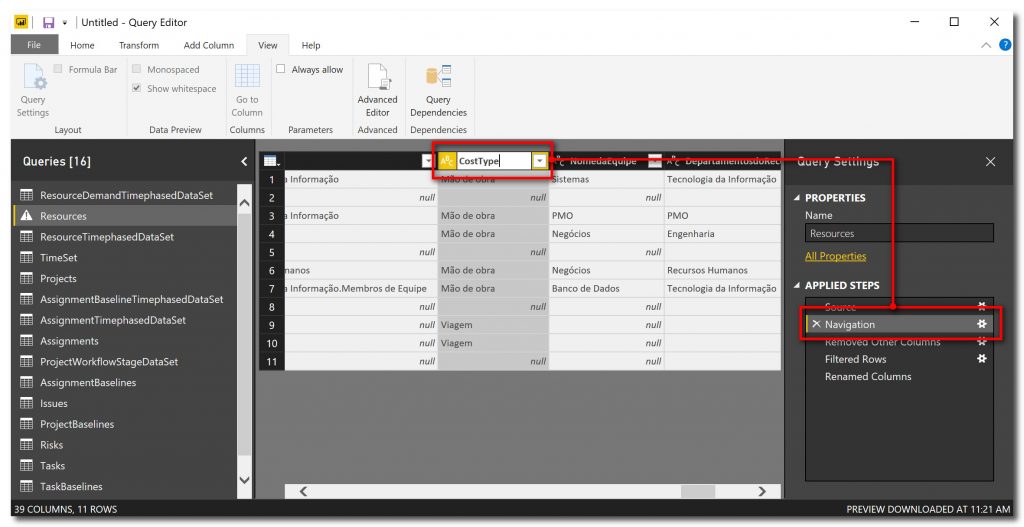

Here I provide a list with all the fields that need to be renamed as defined above. You need to identify the equivalent fields in your own language and manually rename them (note: make sure to use the exact text listed below):
Table: Resources
RBS, CostType, ResourceDepartments
Table: Projects
ProjectDepartments
Table: Assignments
RBS_R, CostType_R, Health_T, ResourceDepartments_R, FlagStatus_T
Table: Assigments
RBS_R, CostType_R, Health_T, ResourceDepartments_R, FlagStatus_T
After you are done renaming all the required fields in the Query Editor, click ‘Close and Apply’. Power BI Desktop will apply the changes to the queries and retrieve the data:
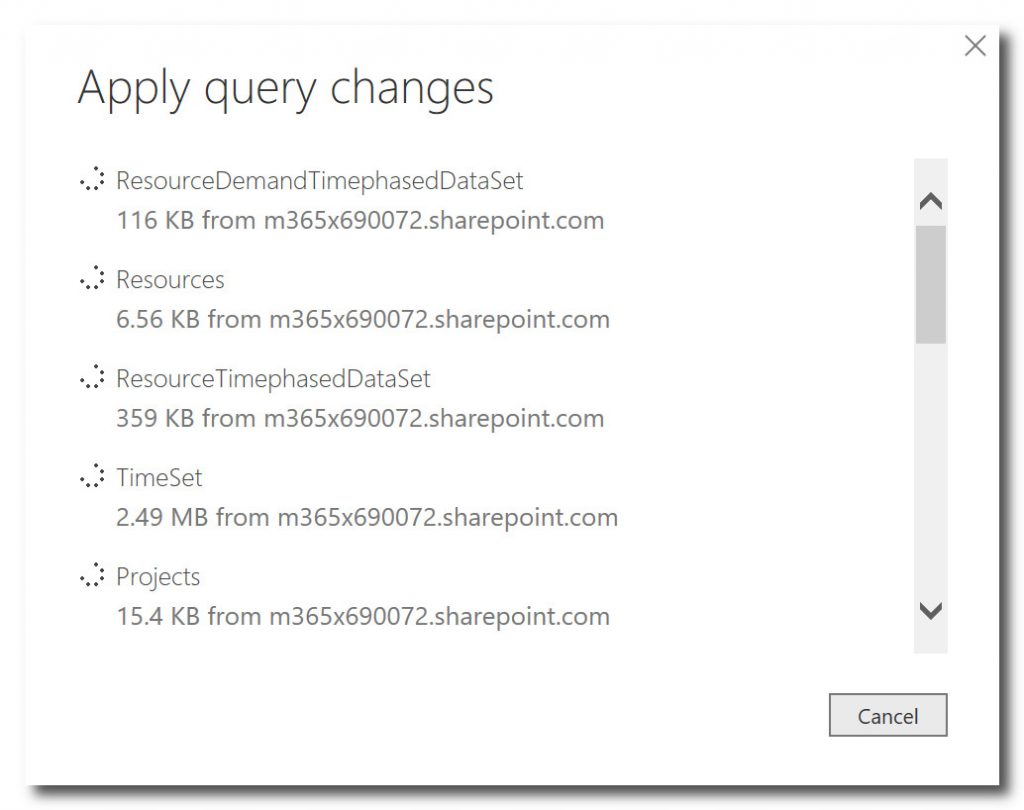
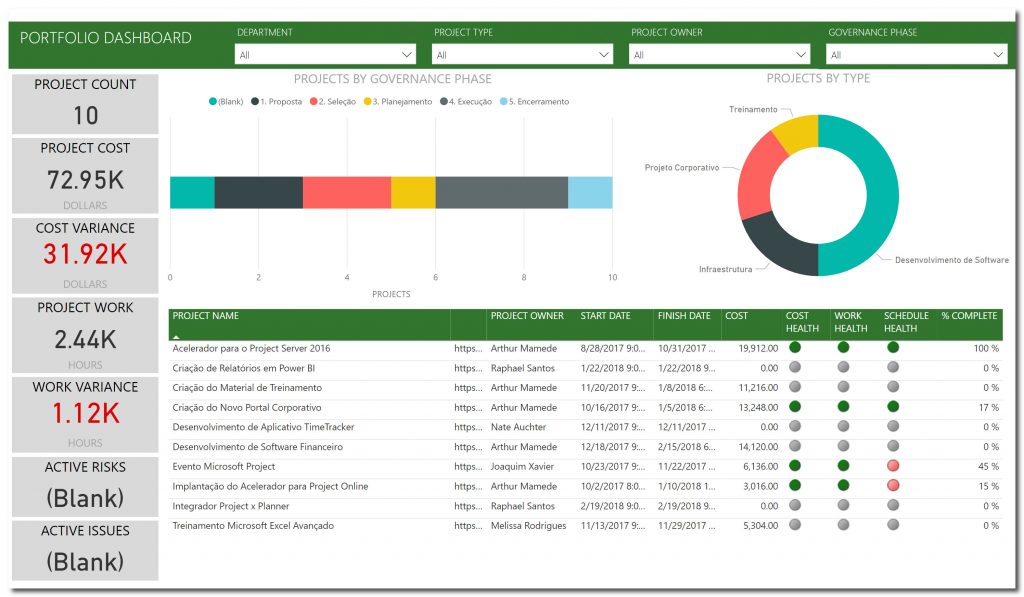
Once the data is retrieved and the reports display your data, you can take some additional steps to make the reports work better.
Some reports contain filters that use text values in English and need to be reapplied using the text values in the specific language chosen. For example, the cards on the ‘Portfolio Dashboard’ page and the ‘Project Status’ page that use Status = ‘(1) Active’ as the text filter for active risks and issues will need to be filtered for the value that represents ‘Active’ in your specific language.
Also, things such as the currency symbol used in some pages (such as ‘Portfolio Risks’ and ‘Portfolio Costs’) should be changed to reflect the currency symbol used in your country. In addition, you might want to change the way the dates are formatted (by default the reports use the MM/DD/YYY format), as well as the tiles that use the word ‘Dollars’, which might not be your local currency (this term appears on the ‘Portfolio Dashboard’, ‘Portfolio Costs’ and ‘Project Status’ pages).
When you are done customizing the reports to better align them with your own language and format settings, you can publish the Power BI file to your preferred workspace.
You may also want to create custom dashboards in your Power BI workspace. The original Microsoft Power BI PPM Content Pack, when deployed in English tenants, has a dashboard of key tiles, charts, and tables that provide a collection of information at the Portfolio, Resource and Project levels:

However, as we had to deploy the reports using the .pbit file, these out-of-the-box dashboards aren’t included – which is why you can create your own dashboard in accordance with your organization’s look and feel.
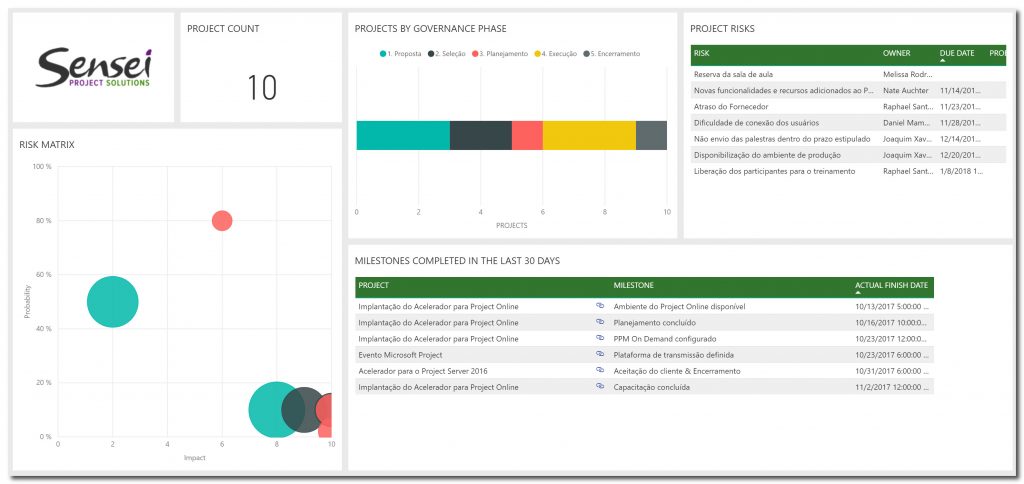
You can choose to use Images, Text Boxes, and Web Contents, as well as the elements that are part of the reports, such as Cards, Tables, Graphs etc. Here is the result for my custom dashboard:

PMP, Microsoft Project MVP

Sensei Project solutions is a recognized global leader in Microsoft project and portfolio management (PPM) solutions focused on improving the way your team works. Sensei’s unique turn-key PPM Platform in the Microsoft Cloud, Sensei IQ™, is designed around your needs and a modern way of working. Sensei IQ™ helps you make informed decisions by understanding how all work fits together with meaningful insights into projects, resources and programs across your portfolios.