Back in 2016 Microsoft released a Gantt visual for Power BI as seen in the post here. The visual is a fantastic starting point for those that require this type of visual in their reports. However, if you intend on using this visual with Project Online data, it is important to note that the duration value for the visual expects a calendar duration, and this doesn’t directly align to the way that Microsoft Project and Project Web App (PWA) store duration values.
Duration values in Microsoft Project and PWA are stored by default in hours. In addition, these values exclude the calendar exceptions (read “Holidays”) that may fall within the project timeline (within the start and finish dates).
In order to force the visual to provide a more accurate duration for the projects or tasks displayed within it, you must create a new calculated column in your data model to provide the calendar date difference (in days) between the start date and the finish date (whether it’s an assignment, task, or project). The out of the box duration fields include calendar exceptions, and Power BI doesn’t automatically know that, or which days to add back in.
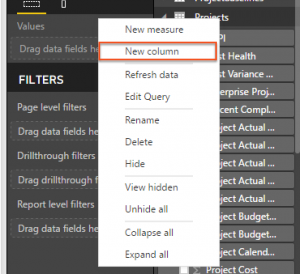
So, to solve this, we just need to add a calculated column to the specific table we care about (in our example we’ll use the ‘Projects’ table) in the data model. To do this, follow the steps below:

Calendar Duration = DATEDIFF(Projects[Project Start Date],Projects[Project Finish Date],DAY)
Now, you also might have an issue, where there may be projects in your system that somehow have a start date that is equal to the finish date and Power BI may not like this formula. If that’s the case, you cans solve the problem by building a little error handling into the formula. We need to set the value to “0” if there is an error (meaning if the start date is equal to the finish date). That formula looks like this:
Calendar Duration = IFERROR(DATEDIFF(Projects[Project Start Date],Projects[Project Finish Date],DAY),0)

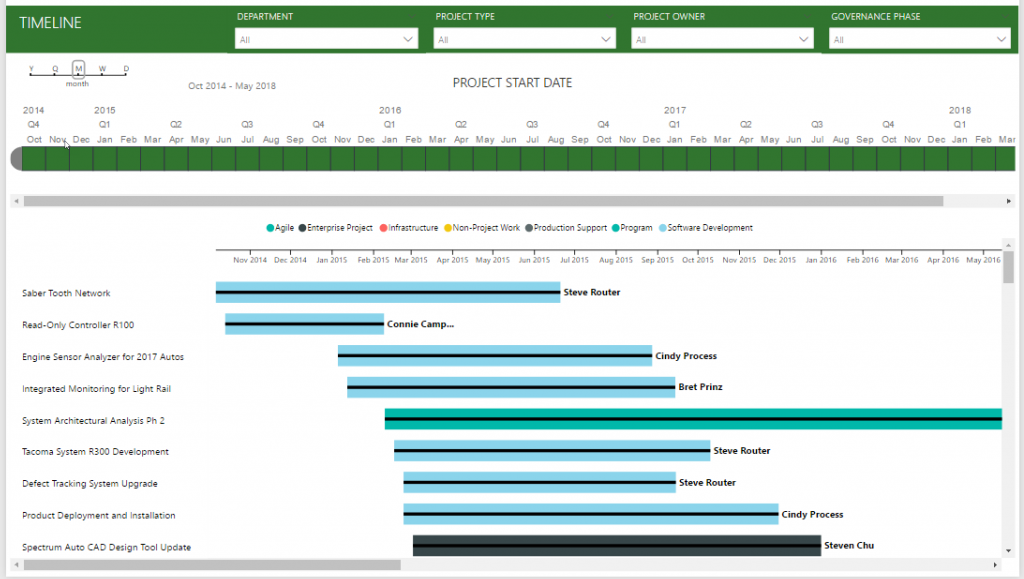
And now, if your Gantt visual originally looked something like this:

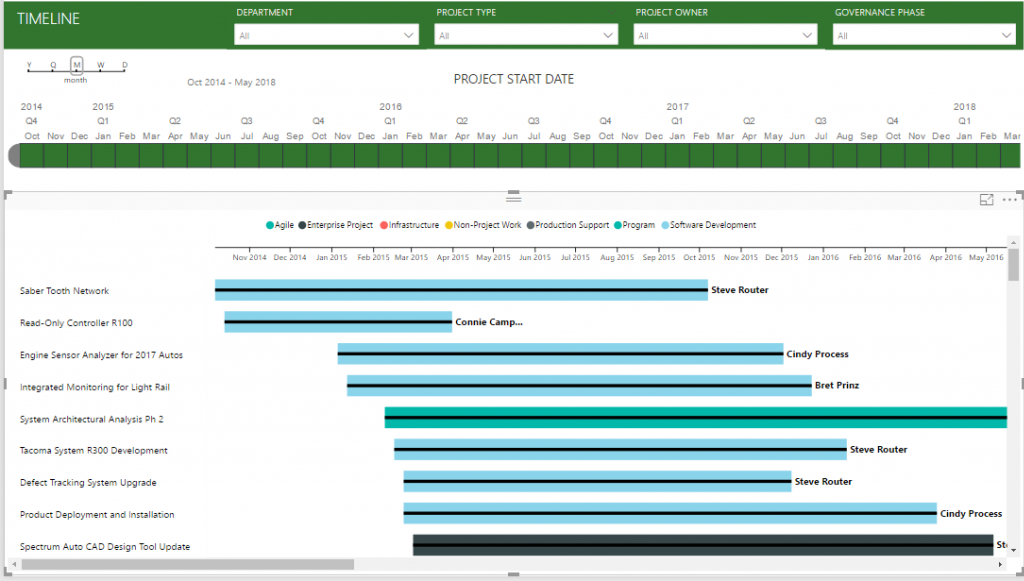
It might now look something like this, accounting for the non-working days that were originally exluded:

Happy Reporting!

MCSE MCT, Director of Products and Solutions, Sensei Project Solutions™

Sensei Project solutions is a recognized global leader in Microsoft project and portfolio management (PPM) solutions focused on improving the way your team works. Sensei’s unique turn-key PPM Platform in the Microsoft Cloud, Sensei IQ™, is designed around your needs and a modern way of working. Sensei IQ™ helps you make informed decisions by understanding how all work fits together with meaningful insights into projects, resources and programs across your portfolios.