FREE e-learning for Microsoft Project for the web
Sign Up
Download PPT: Sensei IQ™ Brief
Sign Up

Insights

Create a Who Does What When Report in Microsoft Project 2013 and 2016

15 mins read /
15 mins read
Sensei

Related: VIDEO: Project Management in Office 365 and Microsoft Teams


Background

In the 2013 and 2016 versions of Microsoft Project, Microsoft has eliminated the old paper-based reports that had been included in the software for many years, and has replaced them with the Dashboard Reports feature. Although many of the paper-based reports were replaced with corresponding Dashboard Reports, not all of them were replaced. One of the missing reports is the Who Does What When report, which cannot be created as a Dashboard Report because it displays timephased Work data. If you are willing to do a little bit of work, you can create the Who Does What When report as an Excel Visual Report instead.

Solution

To create a Who Does What When report as an Excel Visual Report, complete the following steps in either Microsoft Project 2013 or 2016:

  1. Open a project and then click Report > Visual Reports.
  2. In the Visual Reports – Create Report dialog, click the Select level of usage data to include in the report pick list and select the Weeks item on the list.
  3. In the Visual Reports – Create Report dialog, click the New Template button, as shown in Figure 1.

    Figure 1: Visual Reports – Create Report settings

  4. In the Visual Reports – New Template dialog, click the Select Data Type pick list and select the Assignment Usage item on the list, as shown in Figure 2.

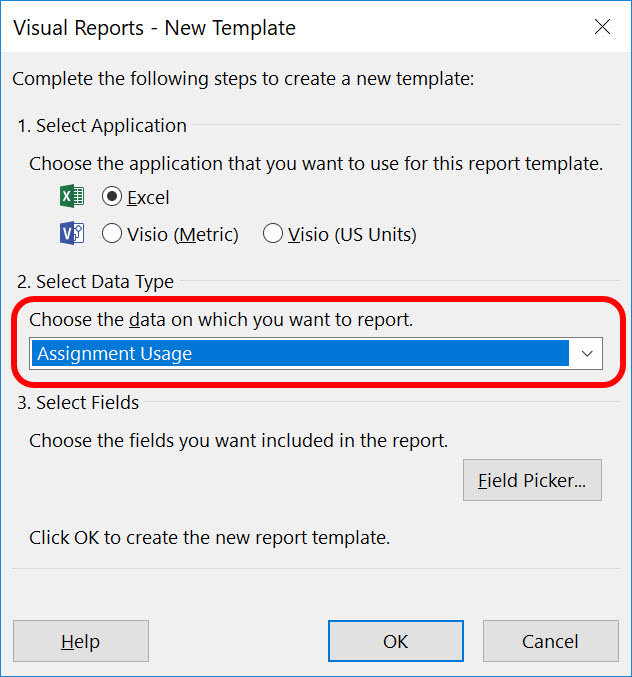
    Figure 2: Select the Assignment Usage item

  5. In the Visual Reports – New Template dialog, click the OK button. Microsoft Project will create a new visual report in Excel, containing a blank PivotTable on the left and a PivotTable Fields sidepane on the right, as shown in Figure 3.

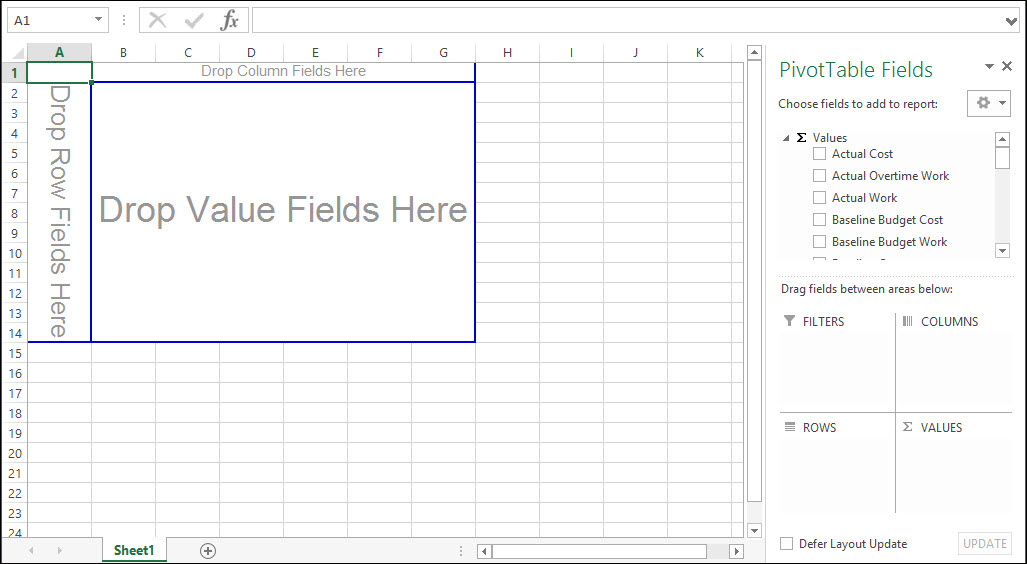
    Figure 3: Blank PivotTable and PivotTable Fields sidepane

  6. In the PivotTable Fields sidepane, scroll down the list of fields and then drag the Resources field to the FILTERS drop area. Doing this will allow you to filter the Visual Report by resources, if desired.
  7. In the PivotTable Fields sidepane, drag the Tasks field to the ROWS drop area.
  8. In the PivotTable Fields sidepane, drag the Weekly Calendar field to the COLUMNS drop area.
  9. In the PivotTable Fields sidepane, drag the Work total field to the VALUES drop area. Figure 4 shows the initial setup in the PivotTable Fields sidepane.

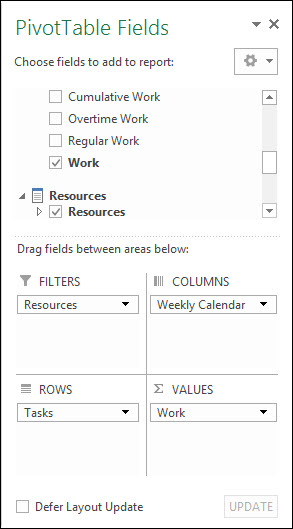
    Figure 4: Initial setup of the report

  10. In the task area of PivotTable, click the Expand (+) button to the left of each task name to completely expand the tasks to the subtask (detailed task) level of data.
  11. In the time area of the PivotTable, click the Expand (+) button to the left of each year and quarter to expand the time data to the Weeks level of data.
  12. Click the Design tab to display the Design ribbon.
  13. In the Layout section of the ribbon, click the Subtotals pick list button and select the Do Not Show Subtotals item on the menu.
  14. In the Layout section of the ribbon, click the Report Layout pick list button and select the Show in Compact Form item on the menu. Your Excel Visual Report should be similar to the one shown in Figure 5.

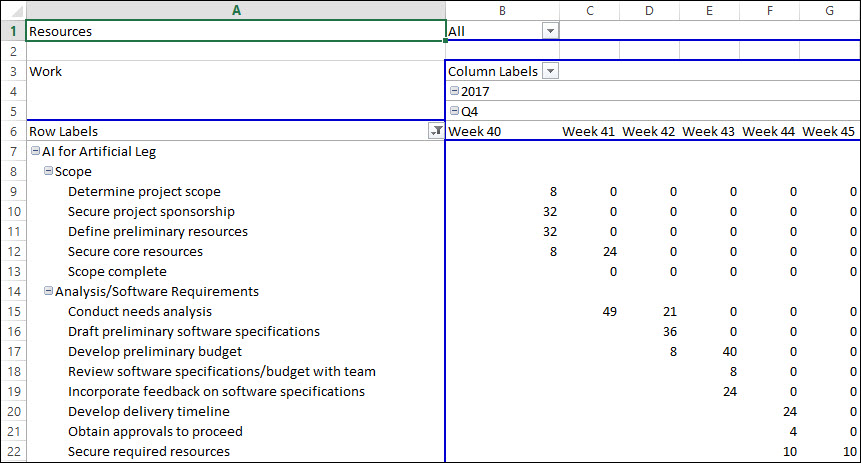
    Figure 5: Completed Excel Visual Report

  15. Click File > Export > Change File Type.
  16. In the Change File Type section of the Backstage, select the Template (*.xltx) item and click the Save As button, as shown in Figure 6.

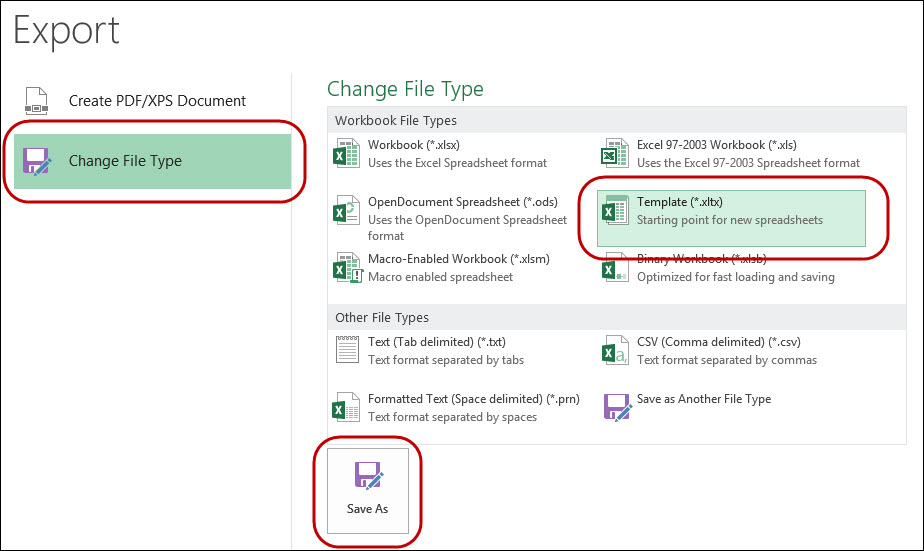
    Figure 6: Export the Excel workbook as a template

    Note: Microsoft Excel should navigate to your default Templates folder. If the software does not automatically navigate to your default Templates folder, you will need to navigate to this folder manually at C:\Users\YourUserName\AppData\Roaming\Microsoft\Templates.

  17. Name the Excel template Who Does What When Report and click the Save button.
  18. When prompted in the confirmation dialog shown in Figure 7, click the Yes button.

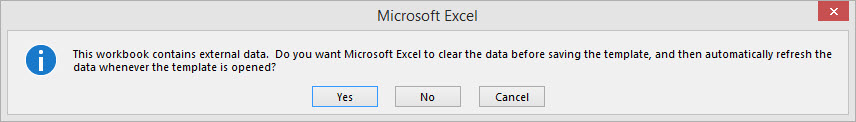
    Figure 7: Confirmation dialog

  19. You now have an Excel Visual Report template that you can use to quickly create your Who Does What When report and then to filter it by resource, if desired. The next time you want to create this new Excel Visual Report, you will find the report listed in the Visual Reports – Create Report dialog, such as shown in Figure 8.

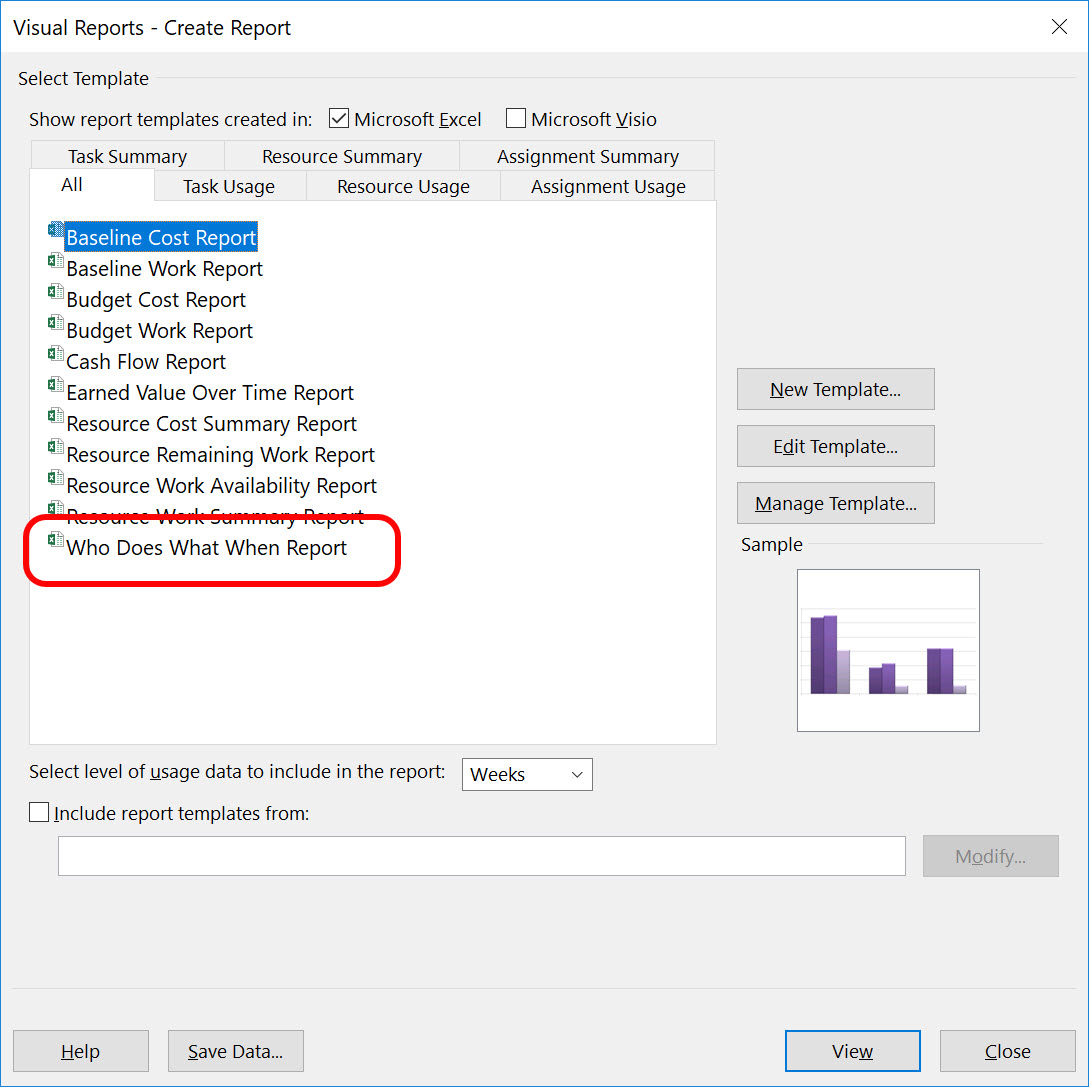
    Figure 8: New report shown in the dialog

  20. To filter the task list by resource, click the pick list button in the Resources section of the PivotTable (upper left corner of the PivotTable). Expand the All list to show every resource name, select the resource whose tasks you want to display, and then click the OK button. One limitation of this Excel Visual Report, of which there is nothing we can do, is that it is not possible to display dates in the Time column headers. The best we can do is to show Week 1, Week 2, etc. Figure 9 shows the completed Who Does What When report, filtered for the tasks assigned to Mickey Cobb.

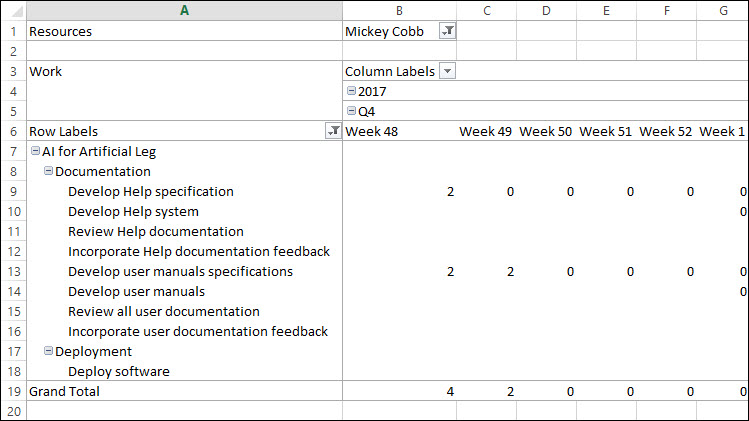
    Figure 9: Who Does What When report


About Sensei project solutions

Sensei Project solutions is a recognized global leader in Microsoft project and portfolio management (PPM) solutions focused on improving the way your team works. Sensei’s unique turn-key PPM Platform in the Microsoft Cloud, Sensei IQ™, is designed around your needs and a modern way of working. Sensei IQ™ helps you make informed decisions by understanding how all work fits together with meaningful insights into projects, resources and programs across your portfolios.

Share on:

Recent Sensei news

15 MIN
Program/portfolio management, Project for the web, Project management, Resource management, Work Management
15 MIN
Program/portfolio management, Project management, Resource management, Work Management
12 MIN
Program/portfolio management, Project for the web, Project management, Project Online, Resource management, Work Management
15 MIN
Program/portfolio management, Project for the web, Project management, Resource management, Work Management
15 MIN
Program/portfolio management, Project management, Resource management, Work Management

let’s GET
STARTED

Interested in learning more? Fill out this form and we’ll be in touch.

address(Required)
Interested in:
Search
Close this search box.