
Question: What happens when you delete baselined data in a Microsoft Project schedule?
Answer: Nothing good.
When you deleted baselined data in a Microsoft Project schedule, you will introduce variance into the schedule in a way that the variance cannot be explained. I ran into this situation recently with a project manager who had deleted a resource from his schedule because the resource left the company. This action introduced variance anomalies that were almost beyond comprehension.
Our best practice recommendation is that you should never delete baselined data from a project schedule. This recommendation is for both types of project data: task data and resource data.
But what happens if you ignore these best practices and you delete either task data or resource data from a project? Let me show you.
Figure 1 shows a project that is in progress with task updates entered through Friday, November 10. Notice the consistency of the variance data shown in the Cost Variance and Work Variance columns. Specifically notice that the Cost Variance value is $8,000 for the Phase I summary task, which is the sum of the Cost Variance values of its five subtasks ($1,600 + $4,800 + $1,600 + $0 + $0 = $8,000). Notice also that the Work Variance value is 160h for the Phase I summary task, which is the sum of the Work Variance values of its five subtasks (32h + 96h + 32h + 0h + 0h = 160h).
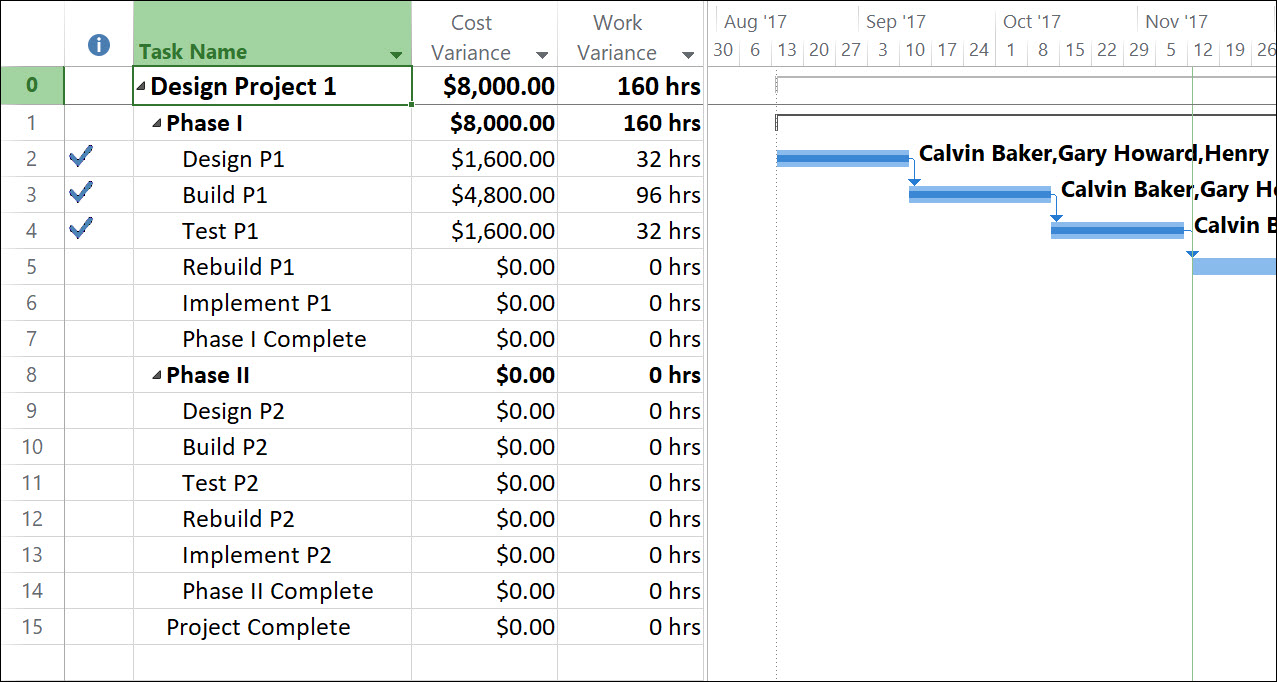
Figure 1: In-progress project with variance
With the completion of the Test P1 task, team members indicated that the Rebuild P1 task is no longer needed, as the testing revealed there are no problems that would necessitate a rebuild of the product. What do you think would happen if the project manager deletes the Rebuild P1 task in response? Figure 2 shows the same project after the project manager deleted the Rebuild P1 task and then relinked the Test P1 and Implement P1 tasks.
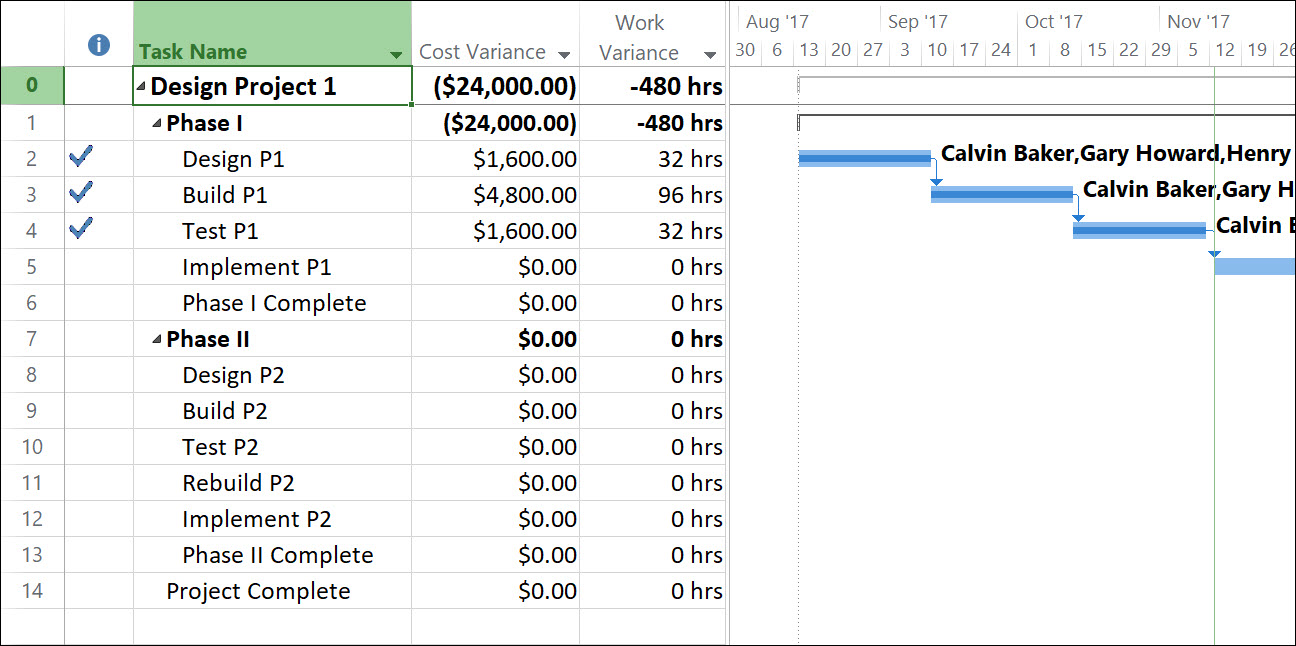
Figure 2: Project after deleting the Rebuild P1 task
Notice the inconsistency of the variance data shown in the Cost Variance and Work Variance columns. Notice that the Cost Variance value is -$24,000 for the Phase I summary task, which is not the sum of the Cost Variance values of its four subtasks. Notice also that the Work Variance value is -480h for the Phase I summary task, which is not the sum of the Work Variance values of its four subtasks. The variance numbers are totally out of sync between the subtasks and their summary task, and there is no way to explain why.
This is the reason for our best practice recommendation that you should never deleted a baselined task. If a task is no longer needed, our best practice recommendation is to cancel the task instead. In Microsoft Project Professional, you can use the Inactivate button in the Task ribbon to cancel the unneeded task. Figure 3 shows the same project, except with the Rebuild P1 task cancelled using the Inactivate feature instead of deleted.
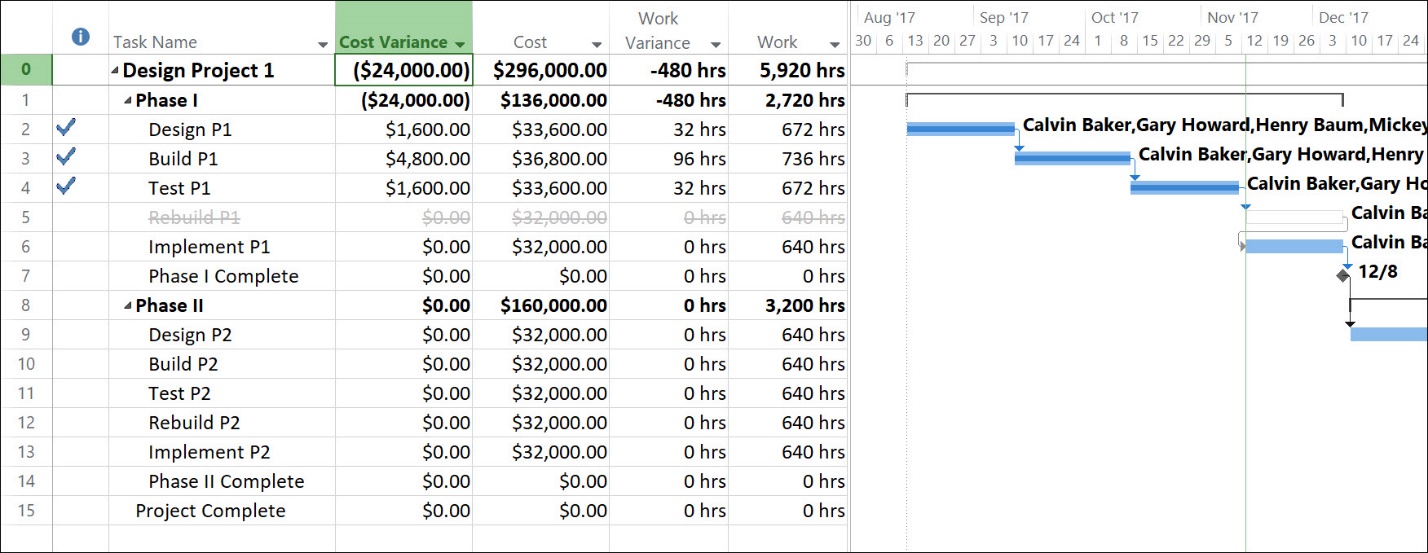
Figure 3: Project after deleting the Rebuild P1 task
As a courtesy, I have inserted the Cost and Work columns in the project shown in Figure 3 so that you can see the consistency of the variance data shown in the Cost Variance and Work Variance columns. Notice that the Cost Variance value is -$24,000 for the Phase I summary task. How did Microsoft Project calculate this value? It is the sum of the Cost Variance values for the first four subtasks, minus the Cost of the cancelled task ($1,600 + $4,800 + $1,600 + $0 -$32,000 = -$24,000). Notice also that the Work Variance value is -480 for the Phase I summary task. How did Microsoft Project calculate this value? It is the sum of the Work Variance values for the first four subtasks, minus the Work of the cancelled task (32h + 96h + 32h + 0h -640h = -480h). By using the Inactivate feature in Microsoft Project Professional, the project manager has an “electronic paper trail” that shows the cancelled task and explains the reason for the variance.
When you delete a baselined resource from a project schedule in Microsoft Project, the variance anomalies get even crazier. Figure 4 shows the Resource Sheet view of the original project shown previously in Figure 1, but with grouping applied by the Type column. Notice that the total Cost Variance is $8,000 and the total Work Variance is 160h for all resources in the project.
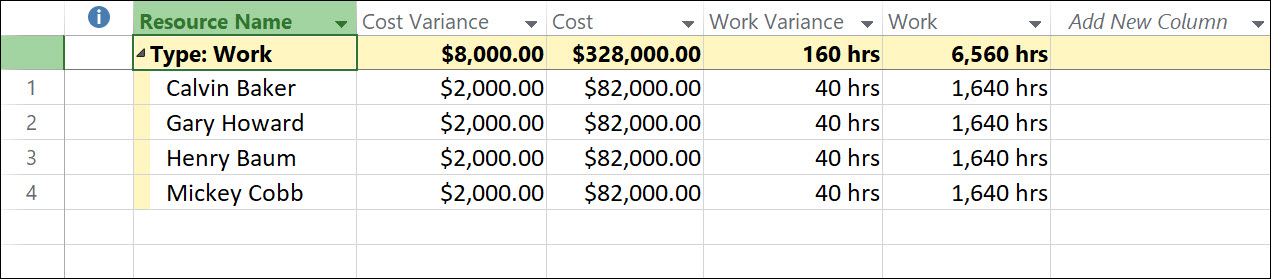
Figure 4: Resource Sheet view of project team members
Suppose that Calvin Baker leaves the company after completing his work on the first three tasks in the project. What do you think would happen if the project manager completely deletes Calvin Baker in response, including all the actual work he has completed in the project? Figure 5 shows the Resource Sheet view of the project after the project manager deleted Calvin Baker from the project. Notice that the total Cost Variance value is now $6,000 and the total Work Variance value is 120h for all resources in the project. Especially notice that there is no evidence whatsoever that Calvin Baker was ever a team member in this project.

Figure 5: Resource Sheet view – Calvin Baker deleted
Figure 6 shows the Gantt Chart view of this project after completely deleting Calvin Baker from the project. Notice how the Cost Variance and Work Variance values for negative for every summary task and detailed task in this project. Especially notice that there is no way to explain why the variance values are negative.
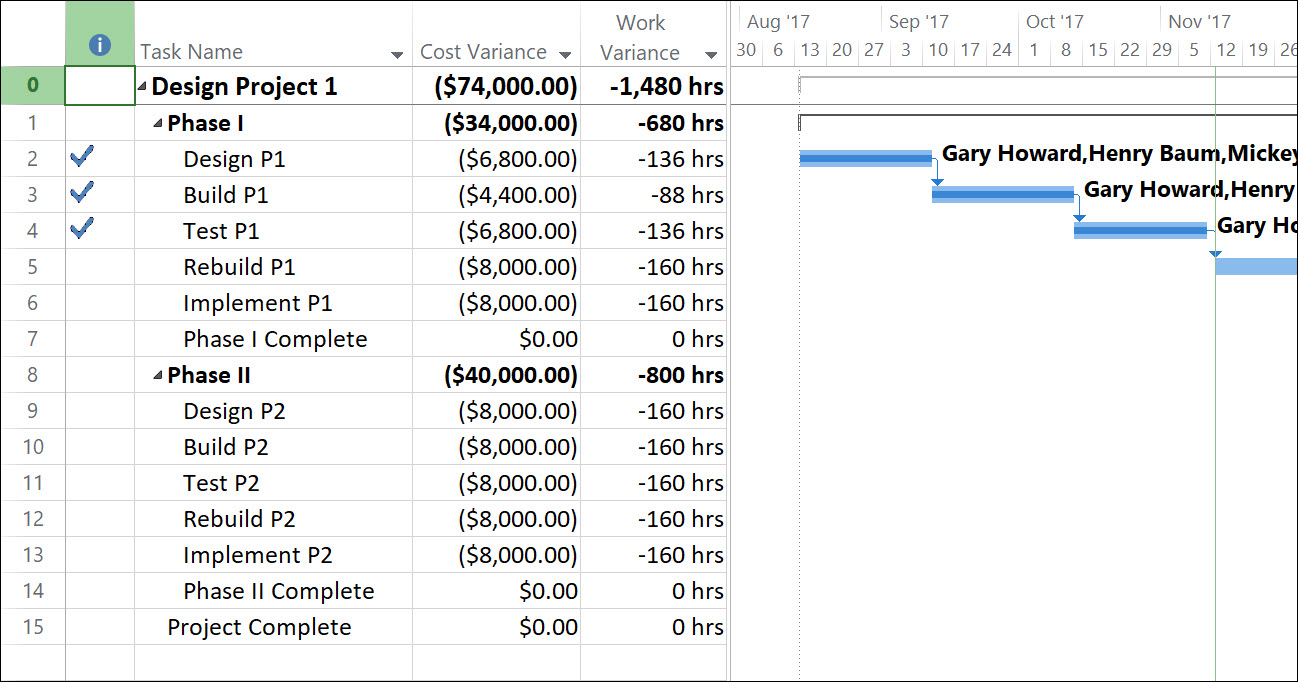
Figure 6: Gantt Chart view – Calvin Baker deleted
Instead of deleting Calvin Baker, our best practice recommendation is for the project manager to reassign Calvin’s uncompleted work to another resource. Figure 7 shows the Resource Sheet view of the project after the project manager reassigned Calvin Baker’s task to a new team member named Pancho Boie. Notice how the Cost Variance and Work Variance values are negative for Calvin Baker, which is caused by reassigning his uncompleted work to Pancho Boie. For Pancho Boie, notice how his Cost Variance and Cost amounts are identical, and his Work Variance and Work amounts of identical. This is because his Work and Cost information was never baselined. In Microsoft Project, there is no way to baseline only selected resources, so there is nothing we can do to hide the Cost Variance and Work Variance data for Pancho Boie.
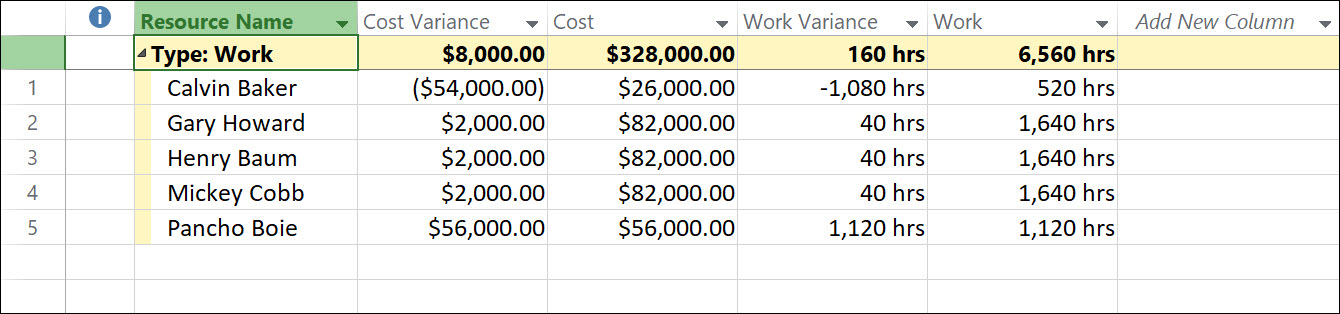
Figure 7 – Resource Sheet view – Calvin Baker’s uncompleted work reassigned
Figure 8 shows the Gantt Chart view of the project after reassigning the uncompleted work from Calvin Baker to Pancho Boie. Notice how the Cost Variance and Work Variance values are identical to those shown originally in Figure 1. This is because reassigning Calvin Baker’s uncompleted work did cause any Work or Cost changes to the tasks originally assigned to him, but which are now assigned to Pancho Boie. If Pancho Boie had a different cost rate than Calvin Baker, there would have been additional variance shown in the Cost Variance columns for the reassigned tasks, however.
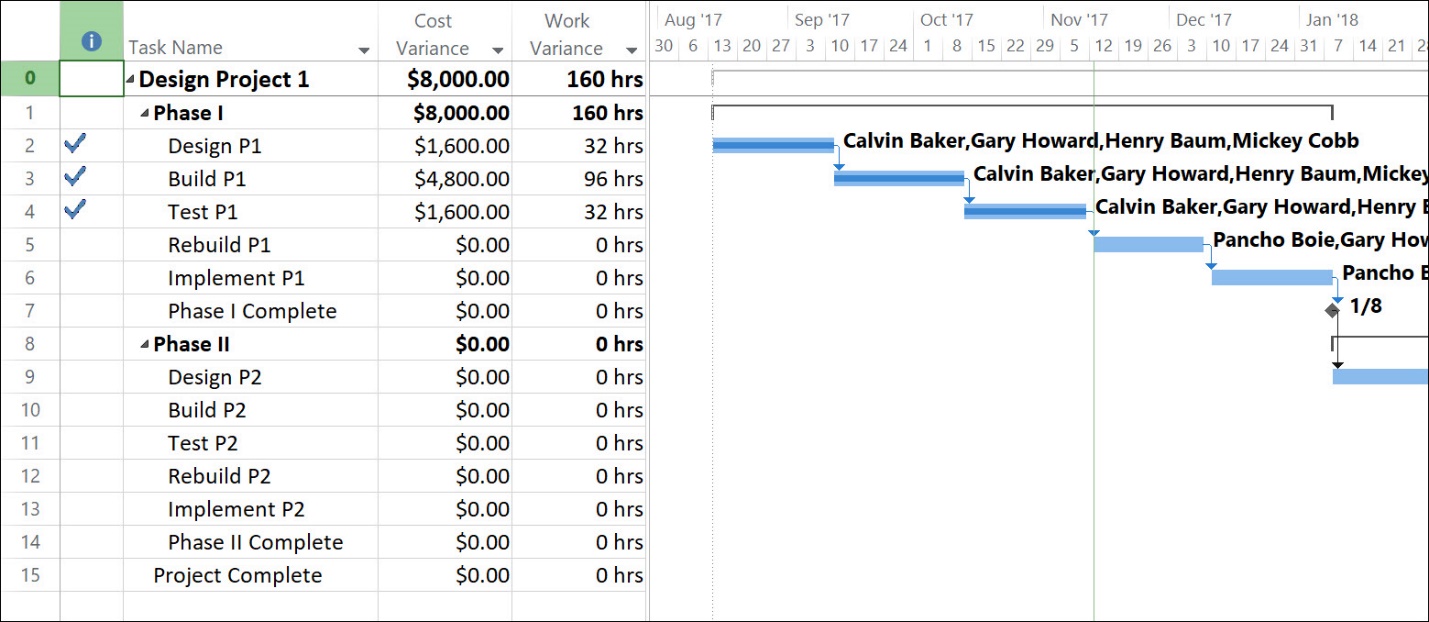
Figure 8: Gantt Chart view – Calvin Baker’s uncompleted work reassigned
To sum up, the best practice recommendations we recommend you follow are these:
")