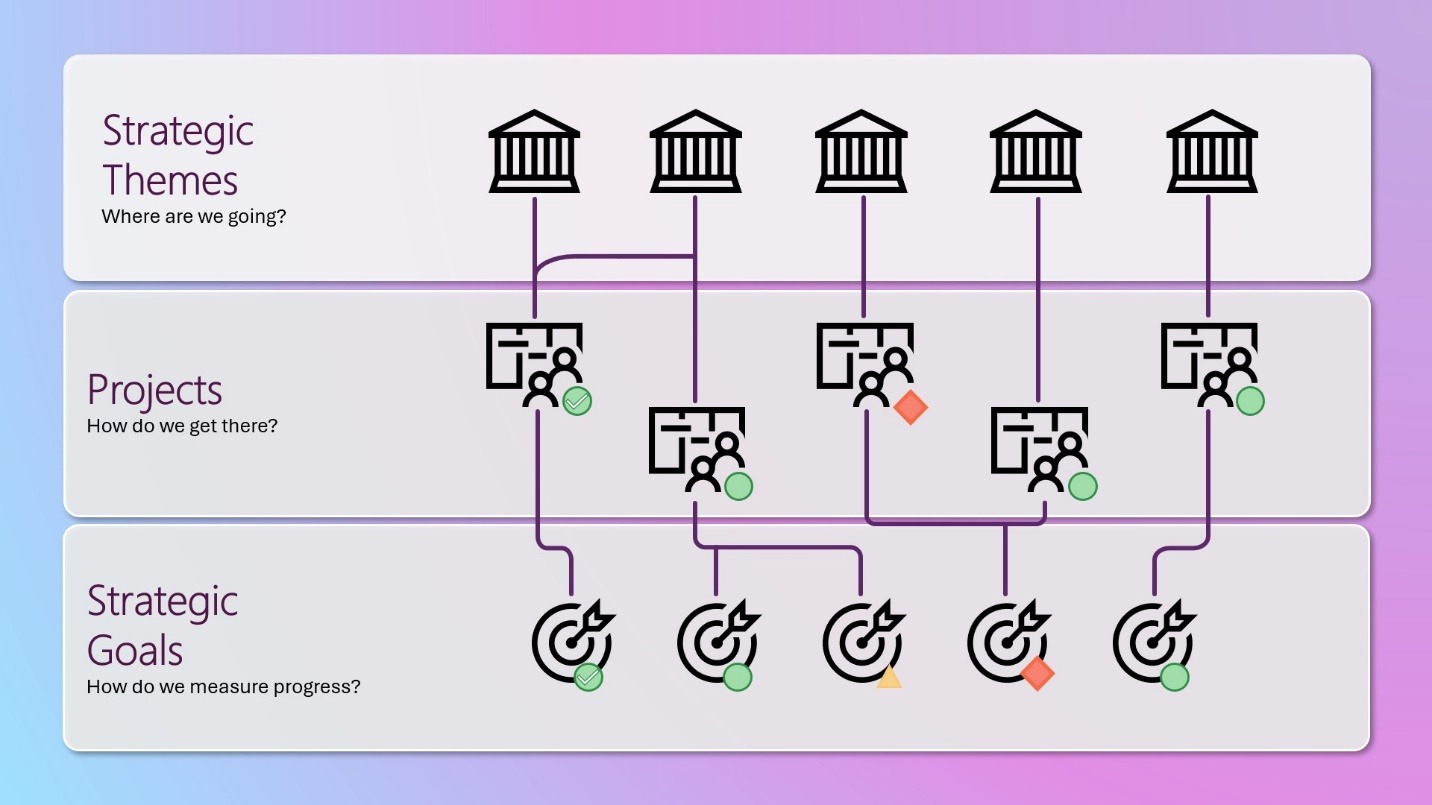
Strategy Alignment is all about getting your organization aligned and clear on where you want to go and what you need to do to get there. And it helps if everyone can visualize that journey.
Your Strategic Themes provide the direction for where you’re going. You may know these as strategic pillars, priorities, objectives, or something similar.
Your Projects represent the work that needs to happen to get you there, and Strategic Goals are how you measure progress. How will you know whether you’ve met your strategic themes if you’re not keeping score?
 Figure 1: Strategic themes leading with projects
You can lead with strategic goals instead of projects if you want to begin with the end in mind.
Figure 2: Strategic themes leading with strategic goals
Related:
Free e-learning for Microsoft Project for the web
Strategy Alignment is not a one-time exercise, but rather an on-going activity, so visualizing it helps to keep focus on what’s important and catch any issues early.
Your Strategic Themes should clearly communicate the end state to help get everyone on board. It’s also a good idea to identify a sponsor for each theme for advocacy and accountability.
Figure 3: Strategic theme example – ‘Employee Engagement’
In the example below, we’re looking at the strategic theme ‘Employee Engagement’. There are nine projects where the work to get there is done, and progress is measured through four strategic goals.
Figure 4: Goal KPI
Each goal has a Key Performance Indicator to show status, and for the target dates, we can also see where we are falling behind and where a target date is missing. For goals that are measurable, we have the target and actual values as well as the percent complete.
Let’s take a closer look at the goal to ‘Increase employee retention’. A goal can be associated with a department and be measured as revenue, cost, percent, number, or without a measure. This goal is for the HR department and measured as a percentage. We have a target value of 95% employee retention, and the actual value is 91% at the moment; but we have until December 20 of this year to improve that.
Figure 5: Goal example – ‘increase employee retention’
The status values are ‘not started’ (which is the default and shown as a white circle in the reports), on track (green), behind (red), at risk (yellow), and closed is a green circle with a checkmark.
You do also have the option of tracking benefits realization well beyond the completion of both the project and the strategic goal, but we’ll save the details of that for another time. The associated projects that help support this goal are on the projects tab. Below, we see five projects. Two are managed in the new Planner, one in Azure DevOps, one in Jira, and one in Project Online. Relationships between projects and strategic goals are many-to-many, but a goal can align only to one theme.
Figure 6: Strategic Goal – Projects tab
By default, we see the projects first and then the goals within each, but we can also pivot this view to focus on the strategic goals first and the projects that support each goal.
Figure 7: View showing projects that support each goal
Now the KPI is for the project, and we can see project type, who the project manager is, sponsor, scheduled finish date, and progress.
Figure 8: Project Details
If we open the ‘Employee Satisfaction Survey’ project, we have access to all the details here. And on the Strategy tab is where we can see all the goals associated with this project.
Figure 9: Project – Goals on Strategy tab
On the Strategy Overview report, we can see a summary on the left. The donut chart shows goals by status, and we can filter to focus on the red and yellow items, for example. Then the cards below show how many portfolios, programs, and projects are aligned to the strategic themes, as well as how many goals are on track and closed, and the overall goal progress.
We can further filter to focus on a specific portfolio, or a specific program, or perhaps look at all the themes under a specific sponsor. Under the filter pane, there are various ways to look at Strategy Alignment across project types, department, target and finish dates, project manager, and much more.
And if you do decide to also track benefits, you’ll be able to see how the benefits are aligned with Strategic Themes, Goals, and Departments.
Figure 10: Benefits Breakdown
Related:
Recorded Demo: Project & Portfolio Management in M365
To learn more about how strategy fits into the overall platform for modern work, Project and Portfolio Management in Microsoft 365, contact us at info@senseiprojectsolutions.com.
Figure 11: Project and Portfolio Management in M365

CEO, Sensei

Sensei Project solutions is a recognized global leader in Microsoft project and portfolio management (PPM) solutions focused on improving the way your team works. Sensei’s unique turn-key PPM Platform in the Microsoft Cloud, Sensei IQ™, is designed around your needs and a modern way of working. Sensei IQ™ helps you make informed decisions by understanding how all work fits together with meaningful insights into projects, resources and programs across your portfolios.